Lab 1: Anypoint Visualizer
Overview
In this lab we are going to present Anypoint Visualizer and how this tool can help us reduce meantime to identification and mean time to resolution, ensuring resilient operations.
Step 1: Anypoint Visualizer View
While you develop new APIs and deploy them, they are going to appear in Visualizer and you are going to be able to see the relationship between them. For this workshop, we already have deployed APIs in staging.
-
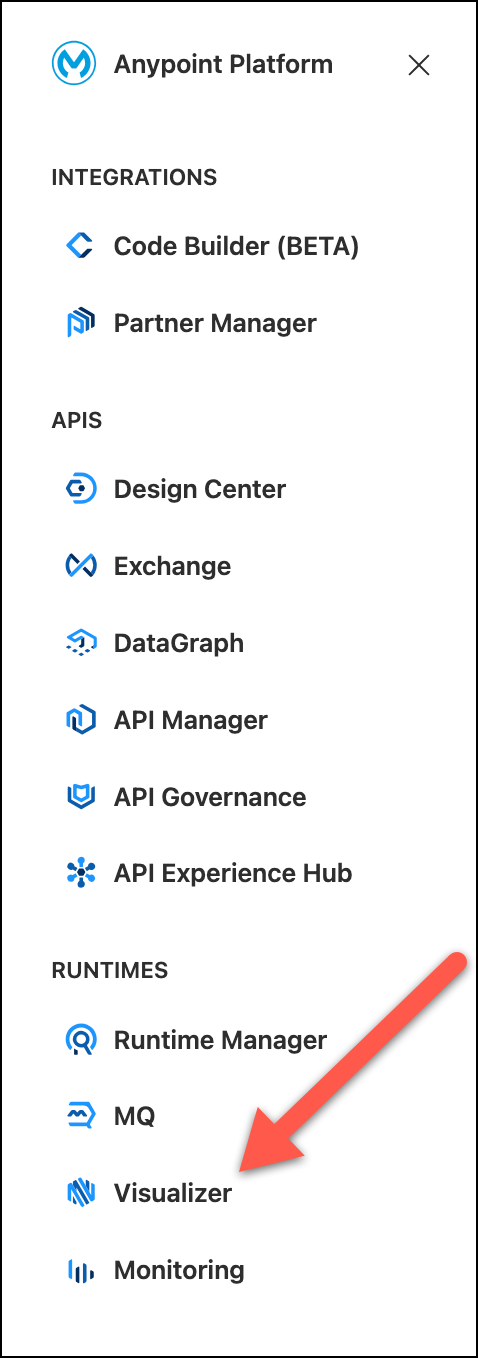
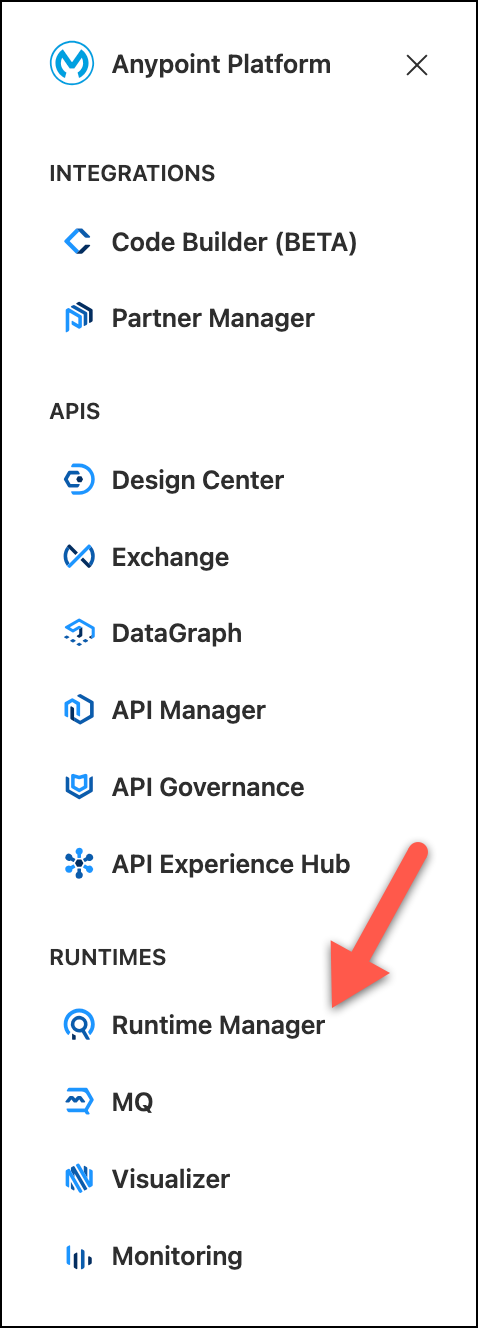
Go the Anypoint Platform. Navigate to Visualizer on the left-side panel or from the main page of the Anypoint Platform
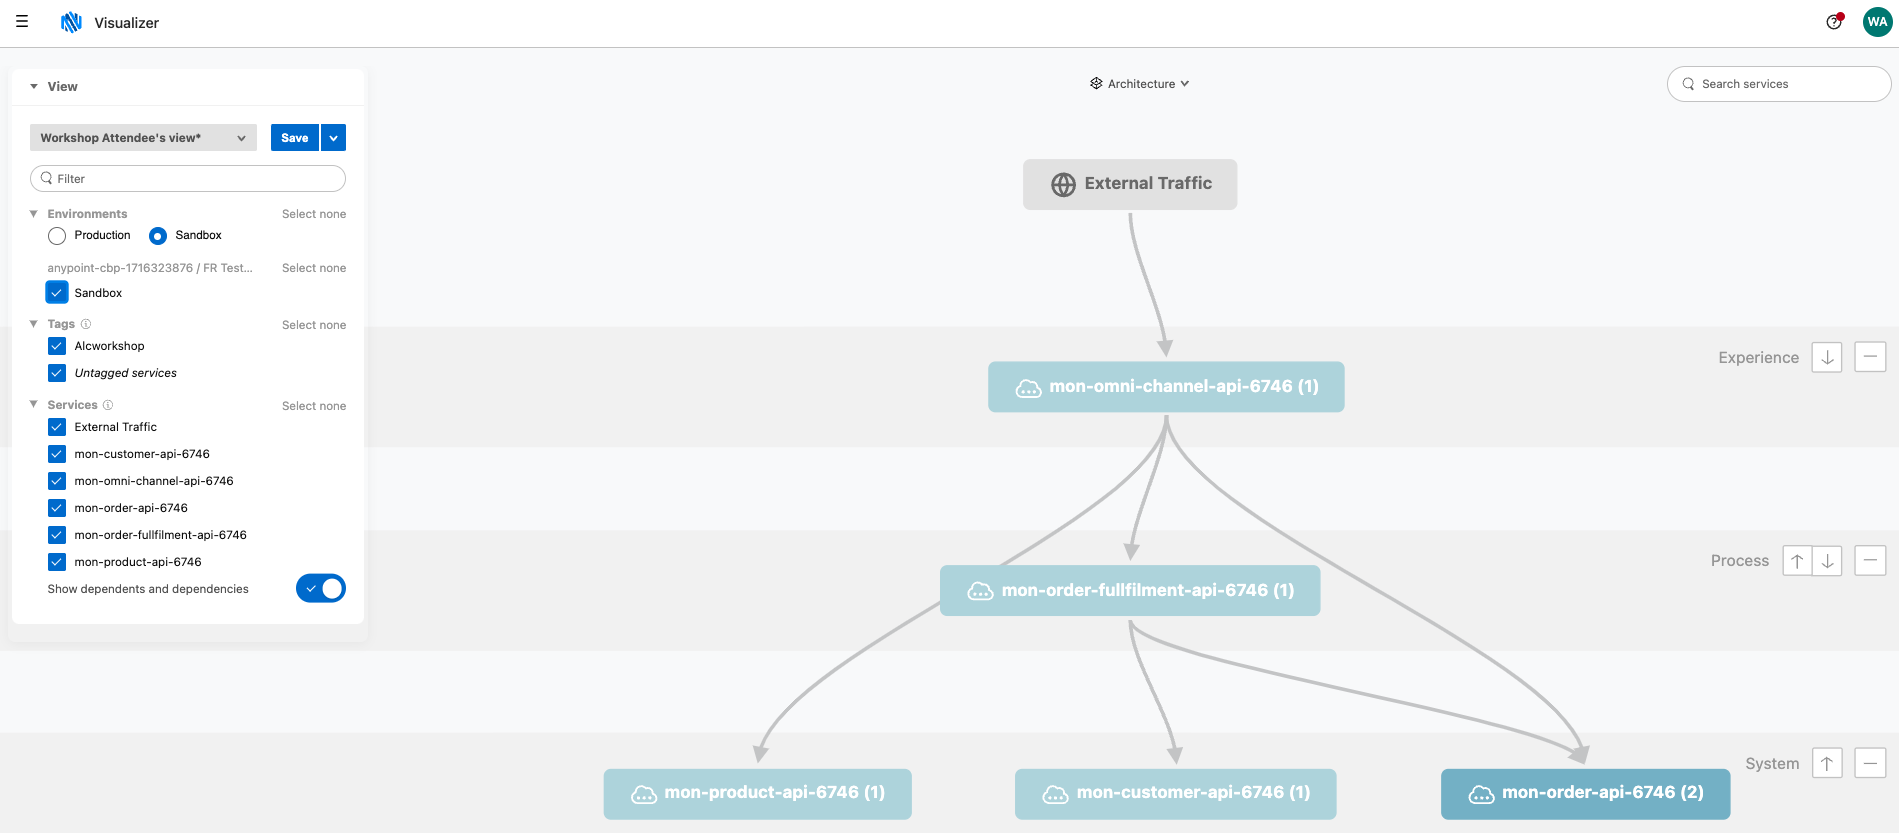
You will find a graphic that shows the Architecture.
-
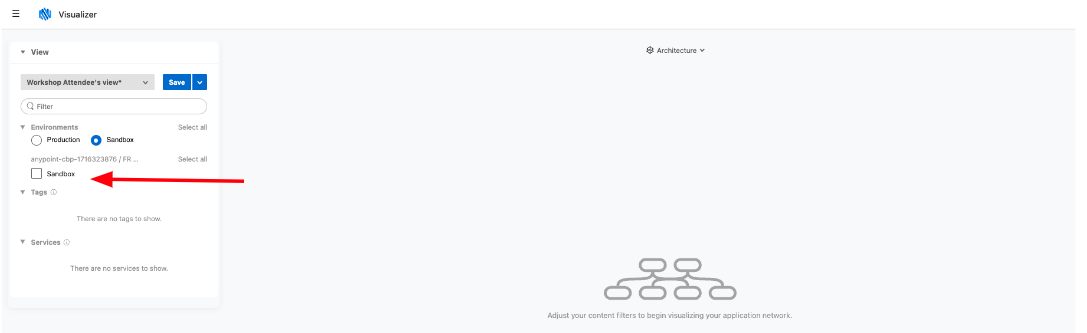
On the left panel, choose the sandbox environment that corresponds to your Business Group.
If you don’t see any graphic check alcworkshop in the Tags section.
Anypoint Visualizer provides a real-time, graphical representation of the APIs, and Mule applications that are running and discoverable. You can use the graph to explore your application network and view multiple metrics, including throughput, response time, and errors for each node in your application network. You will see how easy it is to view the APIs affected in case you need to update an API, or there is one that is failing.
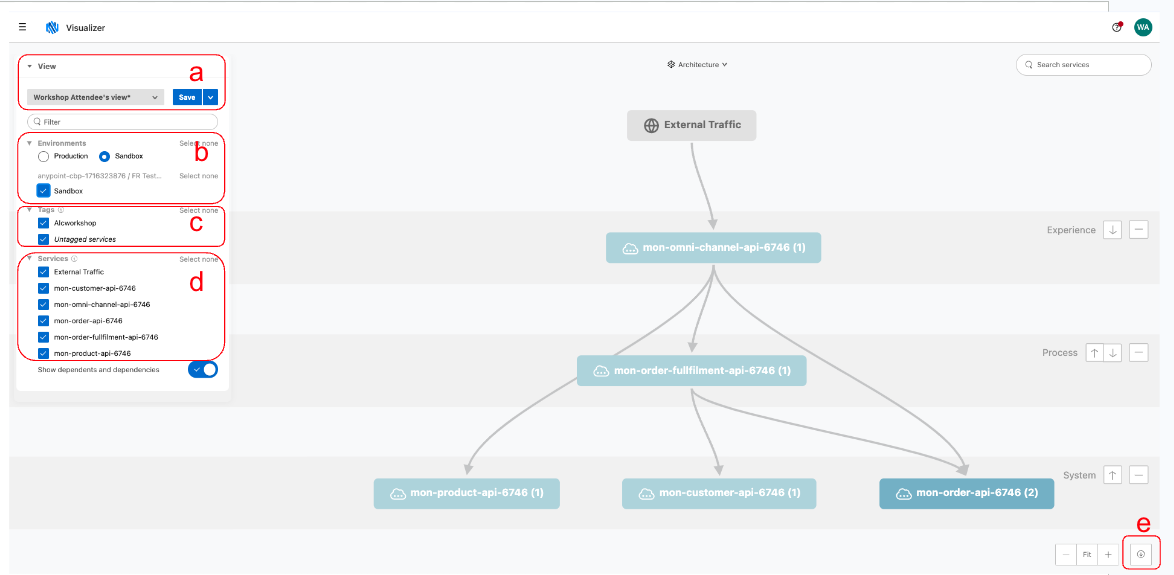
On the left side of the screen you can see different filters to customize your view.
-
Views - This is a combo box where you can find pre saved views. You can also save the current one by pressing the save button.
-
Environments - You can see Production or Sandbox APIs. You can choose one or many business groups and eventually you can select all of them.
-
Tags - You can tag the deployed APIs so then you can filter by those tags. In this case the default deployed assets has the tag Alcworkshop. In the next section you are going to deploy an API with your own tag and you will see how the filter changes.
-
Services - You can filter the deployed components.
-
Export - Once yo have configured the View. You can export the image to a png file.
It has three use cases, or visualizations: Architecture, Troubleshooting, and Policies. By identifying your use case, you can select the visualization that suits your needs.
We are going to describe the first two.
-
Architecture visualization
The Architecture visualization shows the topology of your application network. In this visualization, you can change display names of nodes, add tags, and assign nodes to layers. The Architecture visualization is most useful for documentation and presentation purposes since you can share your network’s architecture without visible metrics.
-
Click on the mon-omni-channel-api node.
You will see information about the service. This card is divided into the following tabs:
-
Details: Provides information about the node
-
Customization: Provides information about the layer to which the node is assigned and the tags assigned to the node. You can edit the node’s display name or change the layer and tags from this section.
You won’t have the permission to customize the node name, that’s why is not available. 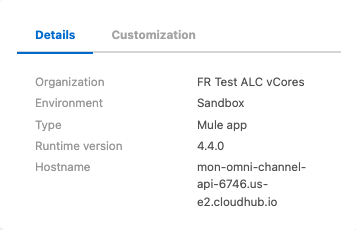 Figure 1. Selected Node
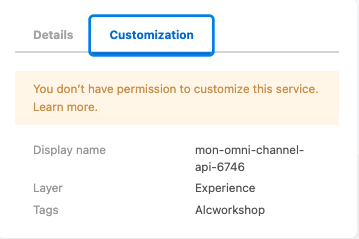 Figure 2. Detail panel
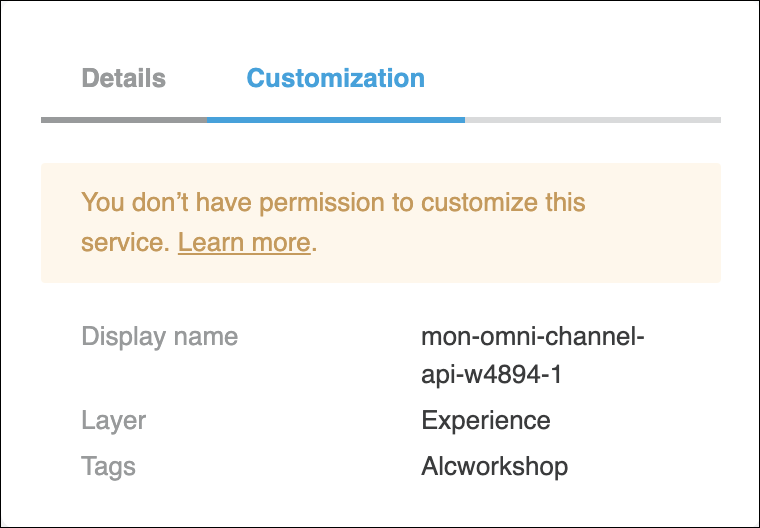 Figure 3. Customize panel
-
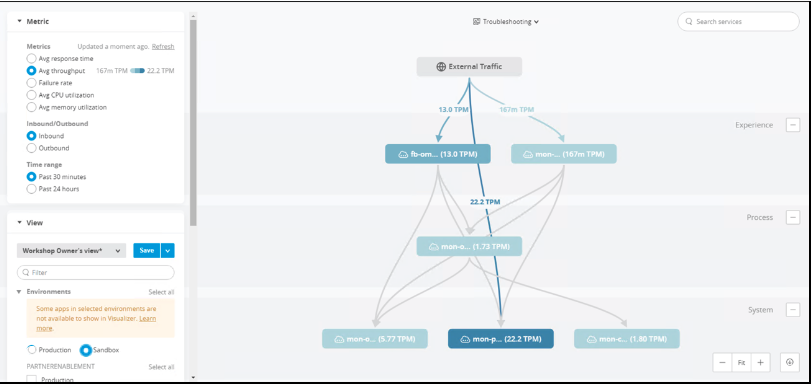
Troubleshooting Visualization
The Troubleshooting visualization enables you to view the health of the system and evaluate performance-based metrics. This visualization helps you identify issues or unusual behavior across your apps and APIs. You can see different Metrics filtered by Time Range.
The available metrics are:
-
Avg Response Time
-
Avg Throughput
-
Failures
-
Avg CPU Utilization
-
Avg memory utilization
Notice the scaled color based on the number of connections. Feel free to see the different views and see how the graphic changes showing different information.
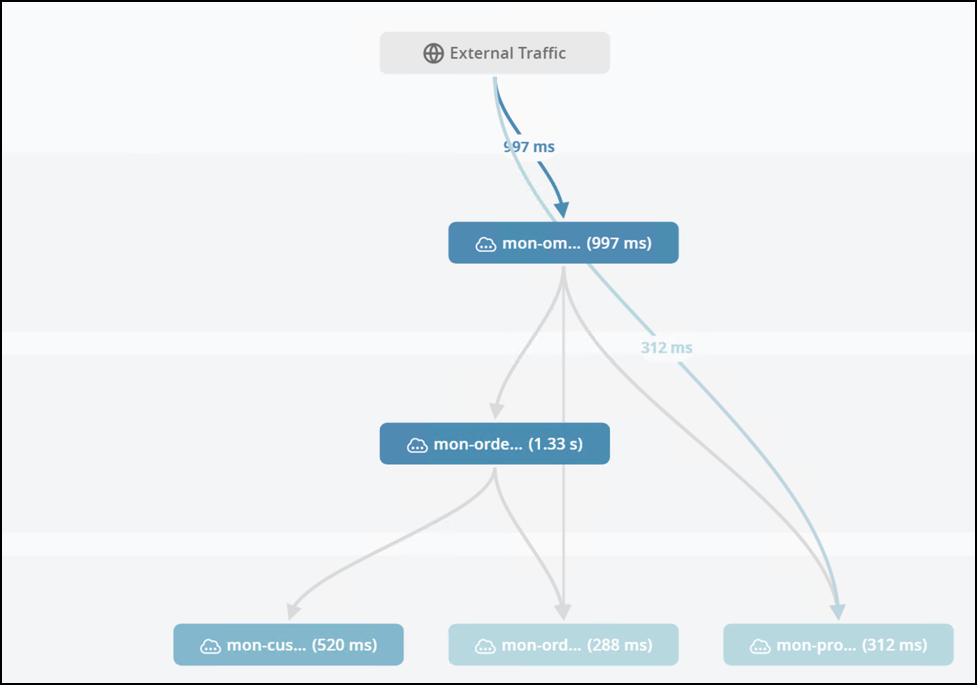 Figure 4. Avg response view
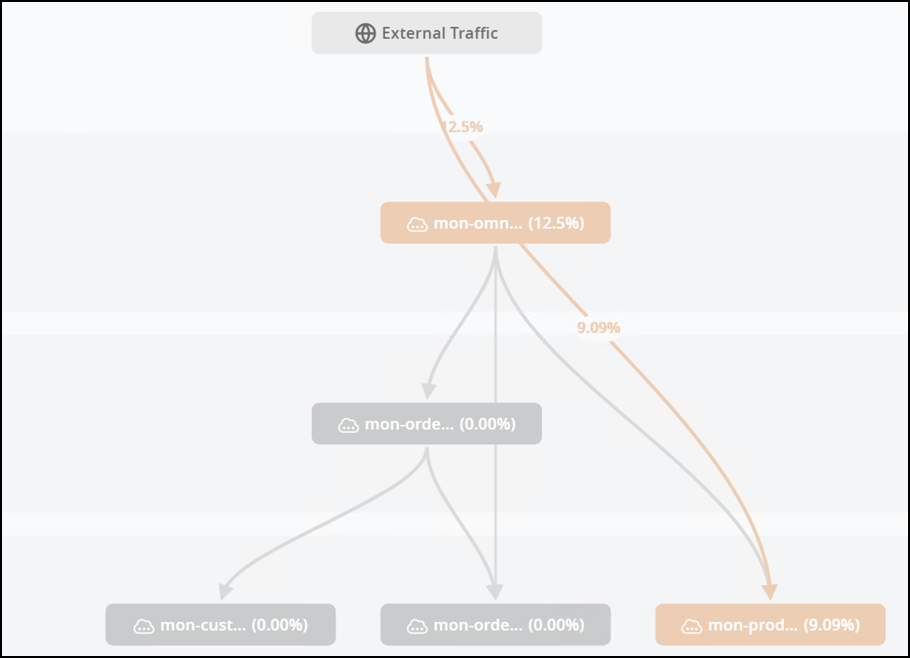 Figure 5. Failures view
Change the Time range to Past 24 hours if you don’t see any error. 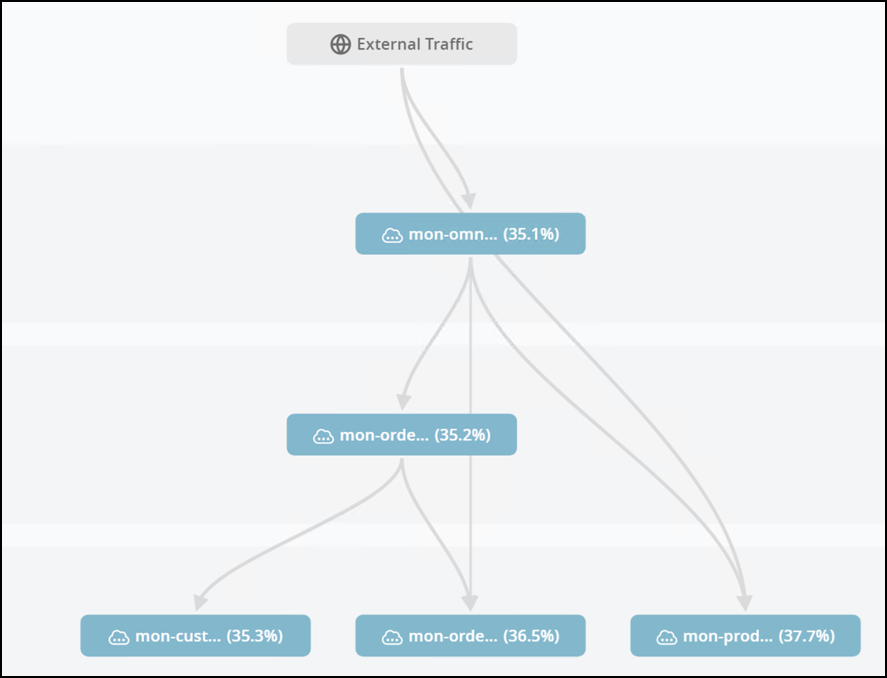 Figure 6. Avg memory utilization view
-
Click on the mon-omni-channel-api-<#> node.
On the left side, you can see the details of the Omni Channel API.
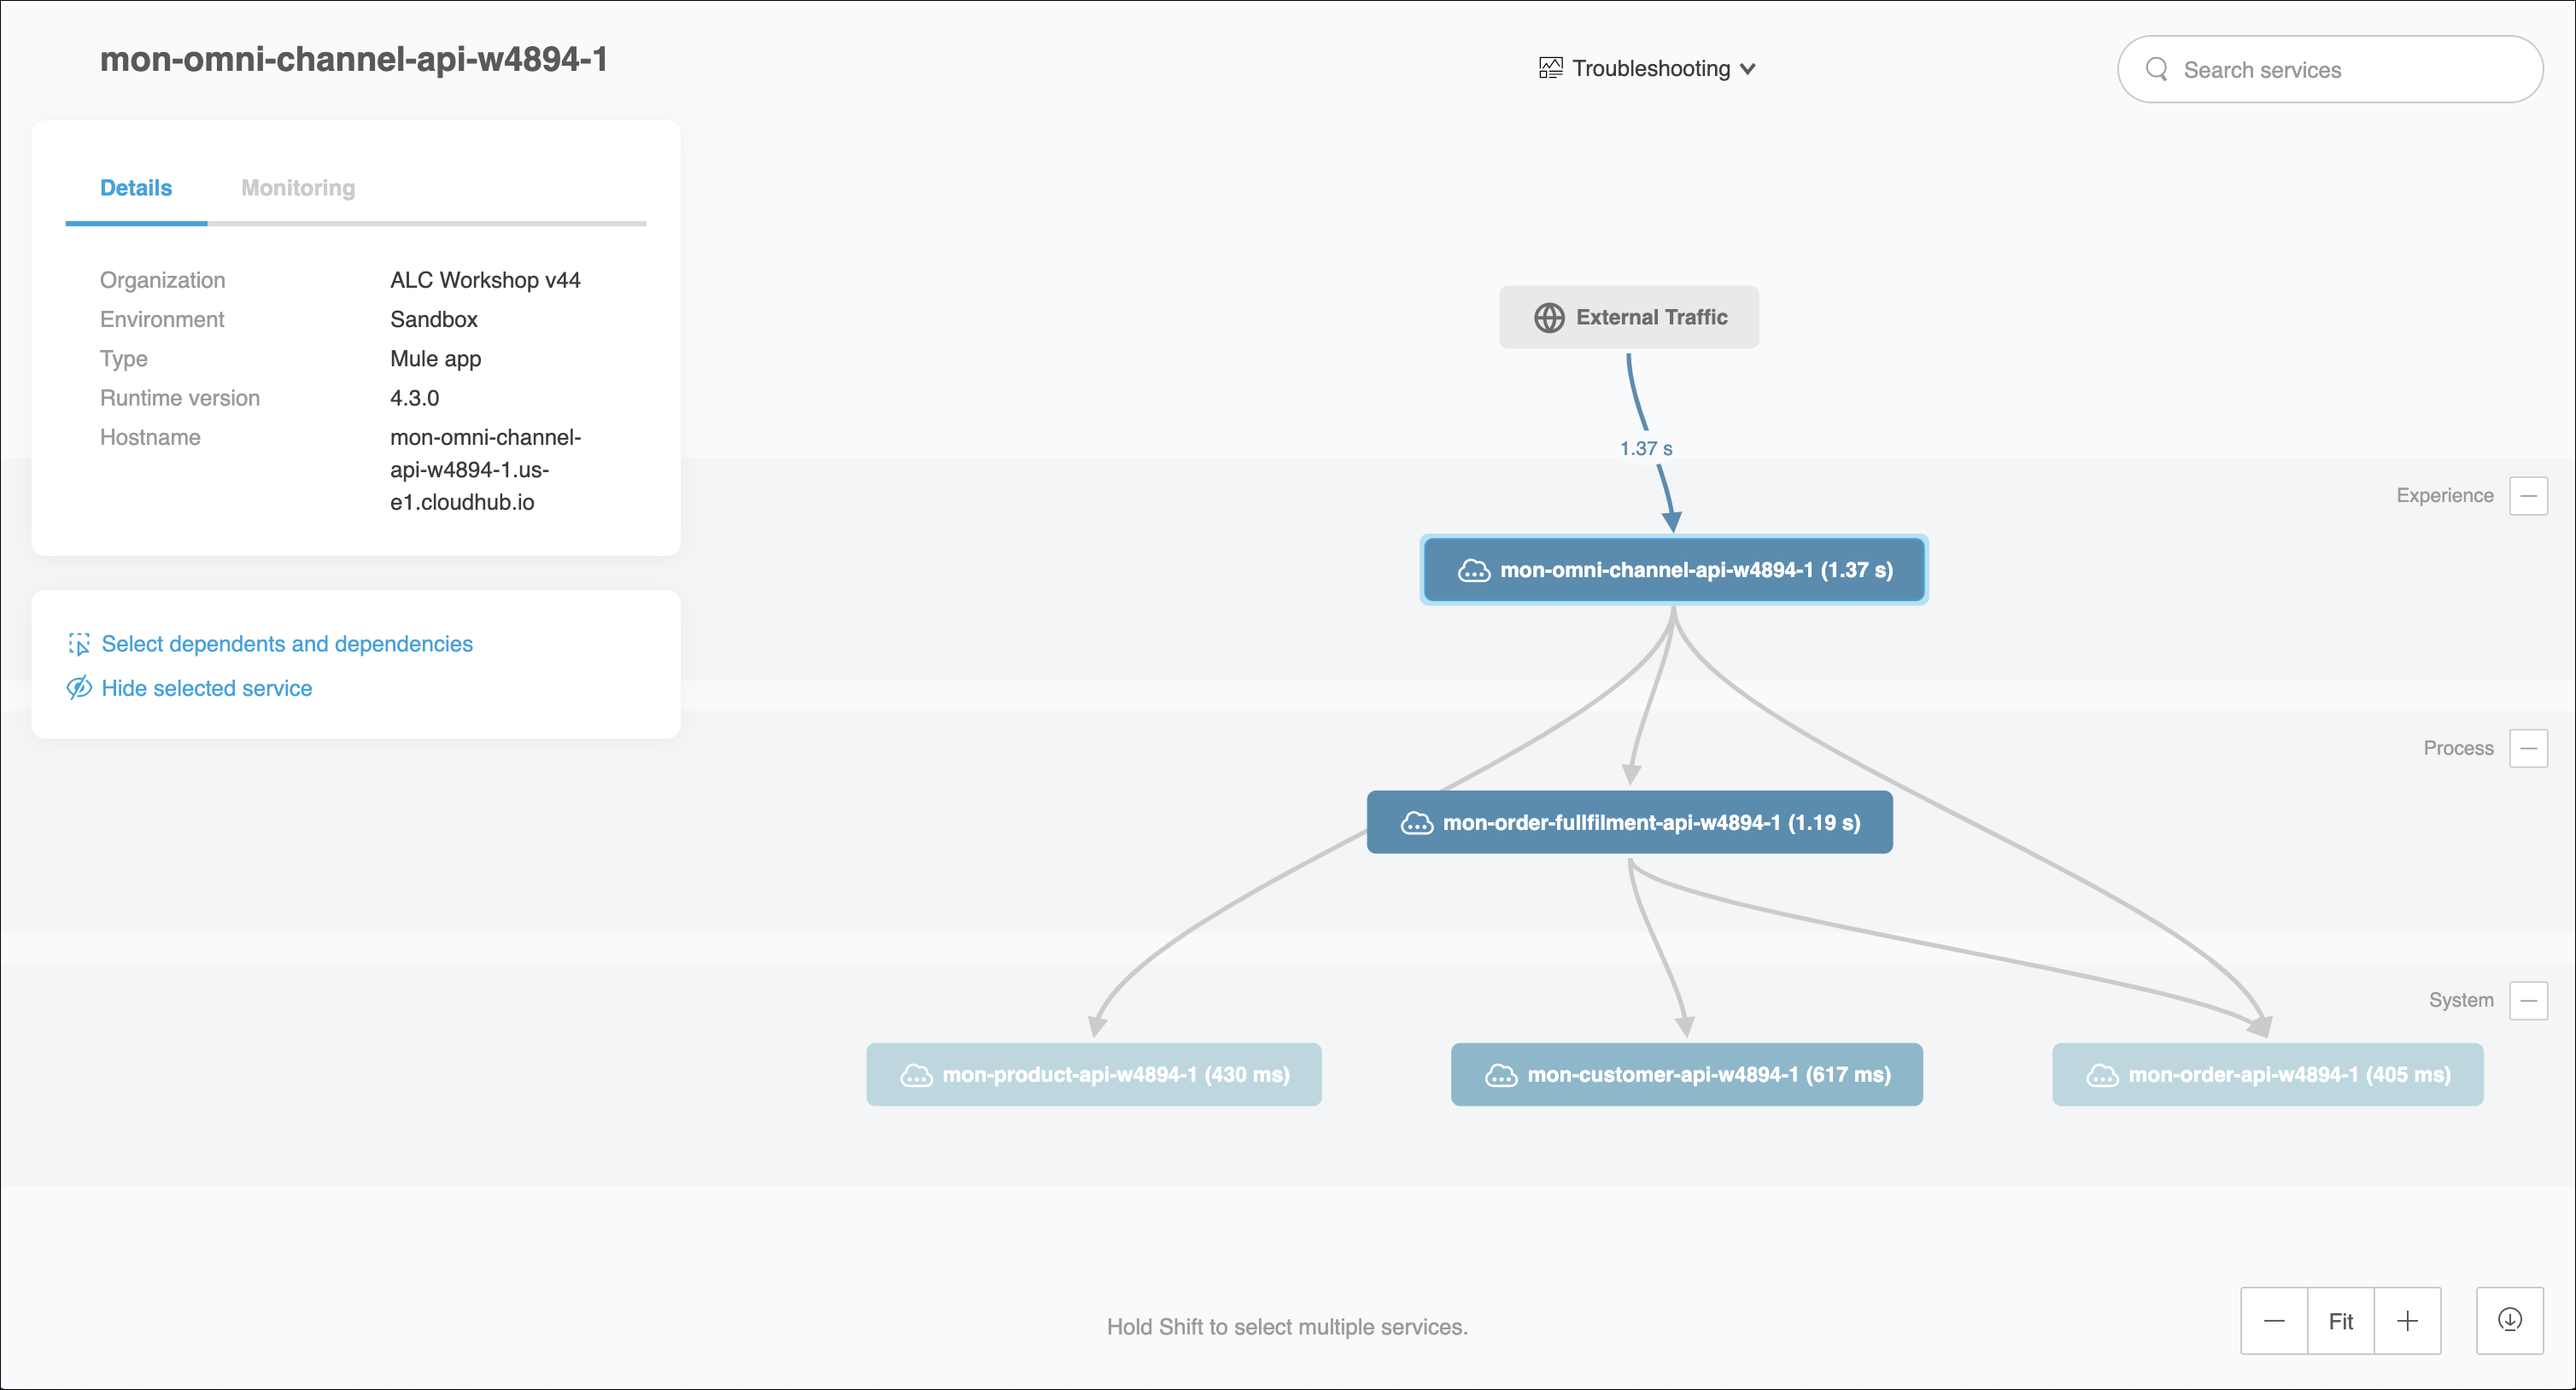
You will find two panels
-
-
Details: In this section you can see general information.
-
Monitoring: You can see specific metrics and dashboards.
You need to have Visualizer Editor Role to change the Customizations parameters. Layer and tags can be set as properties at deployment time. -
Click on any side of the graph outside of the Details view.
-
In Metrics, select to Avg response time and click on the mon-omni-channel-api-<id> again.
-
Click on the Monitoring tab.
You will see two sections
-
Metrics
-
Response time
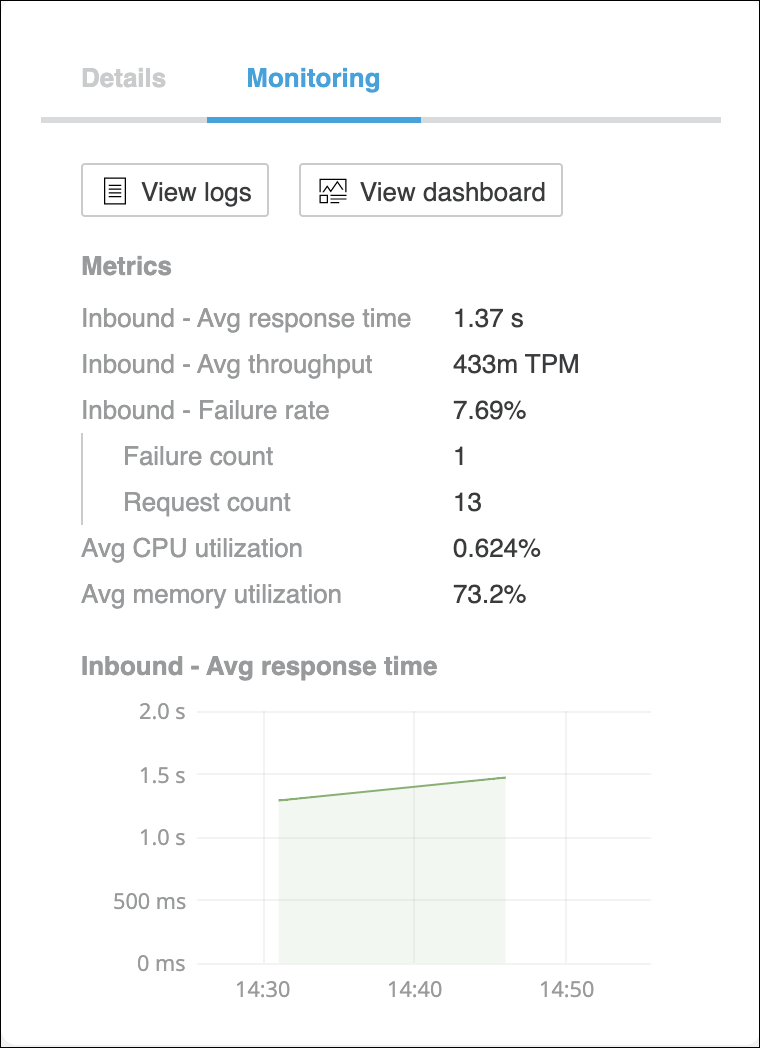
You will see two buttons:
-
-
-
View Logs: this is a link to the application logs in the Runtime Manager.
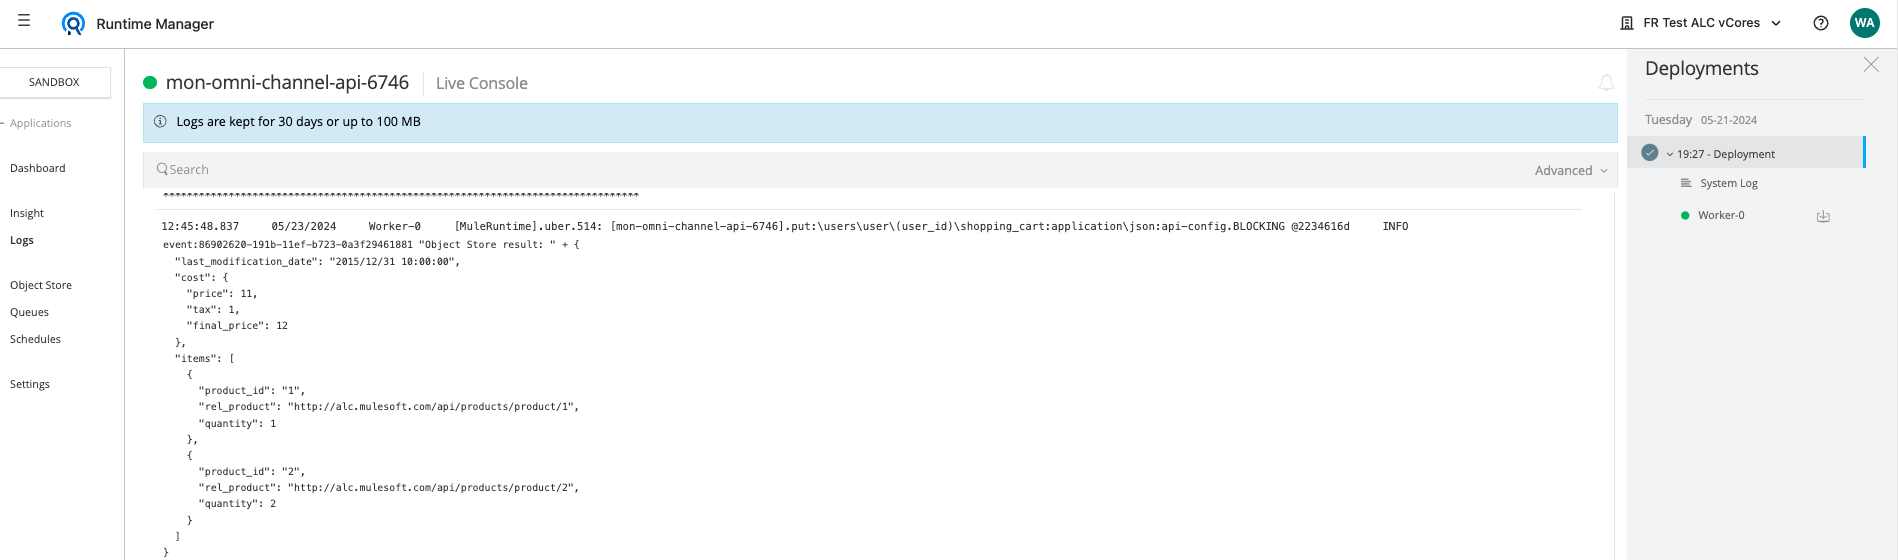
-
View Dashboard: this is a link to the Monitoring Dashboard.
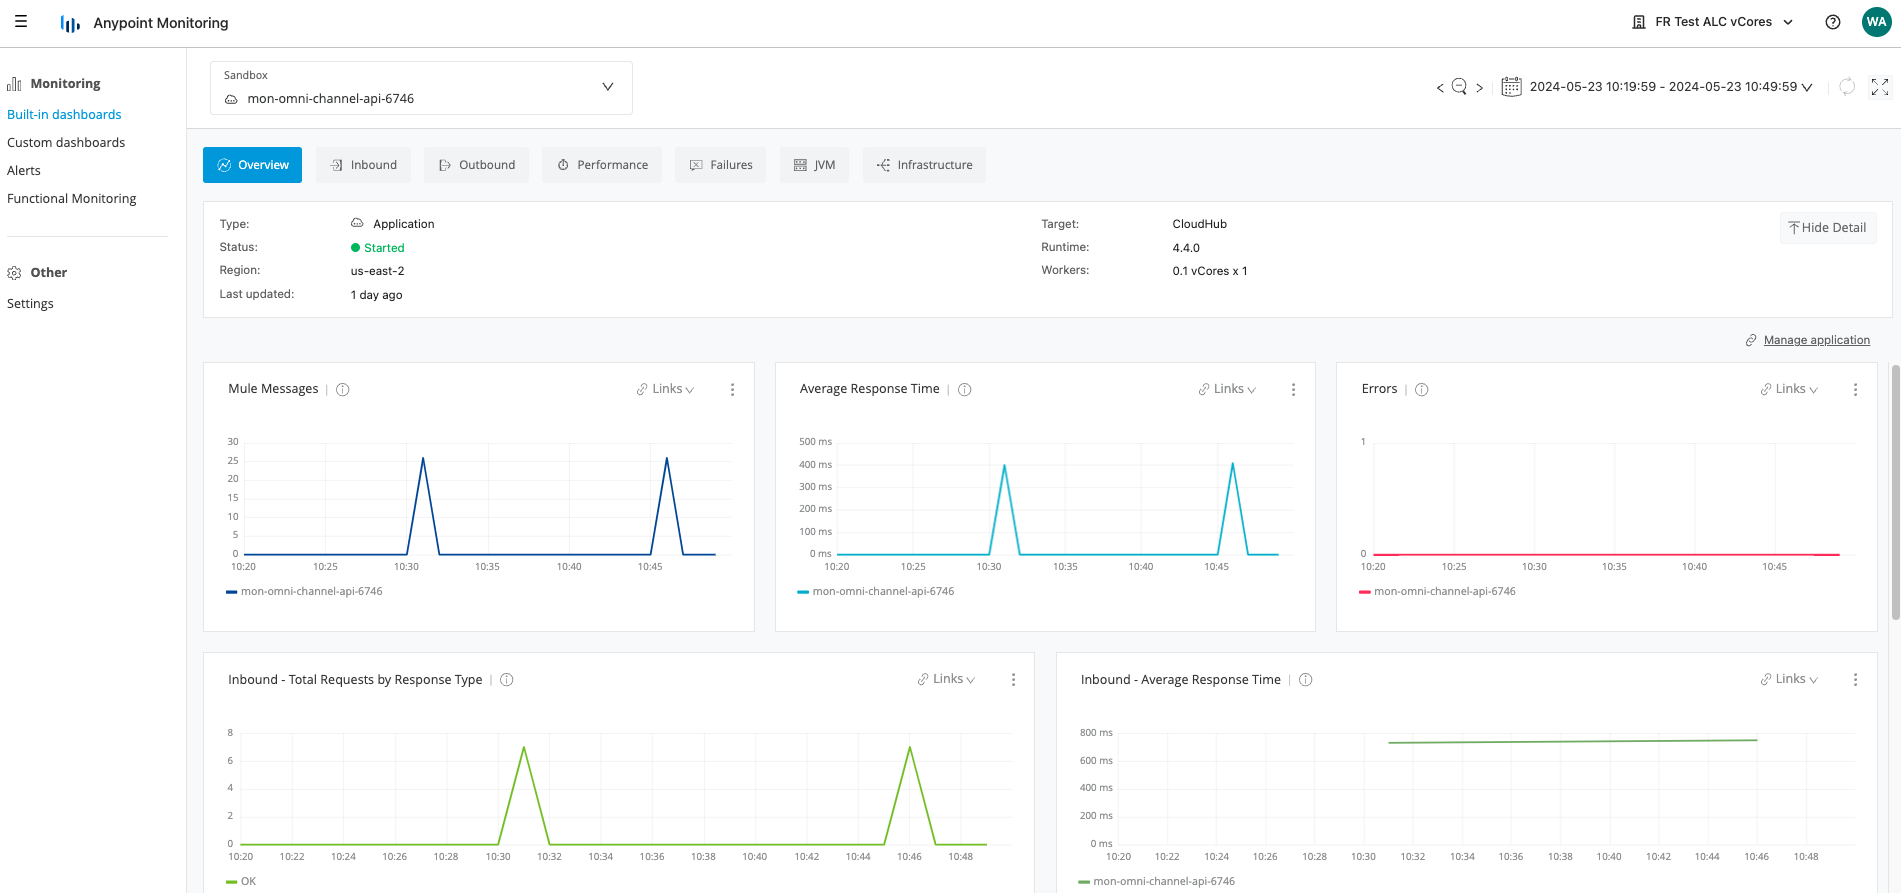
We will cover the Monitoring Dashboard in Lab 2.
Policy visualization
The Policy visualization enables you to see the policy landscape of your application network at a glance. You can view which components are compliant with policies you select, and you can determine where lapses in security or policy application may have occurred.
The Mule Apps deployed, don’t have Managed APIs.
Step 2: Deploy Omni Channel API
We are going to deploy another Omni Channel API to cloudhub and we are going to stress the API.
-
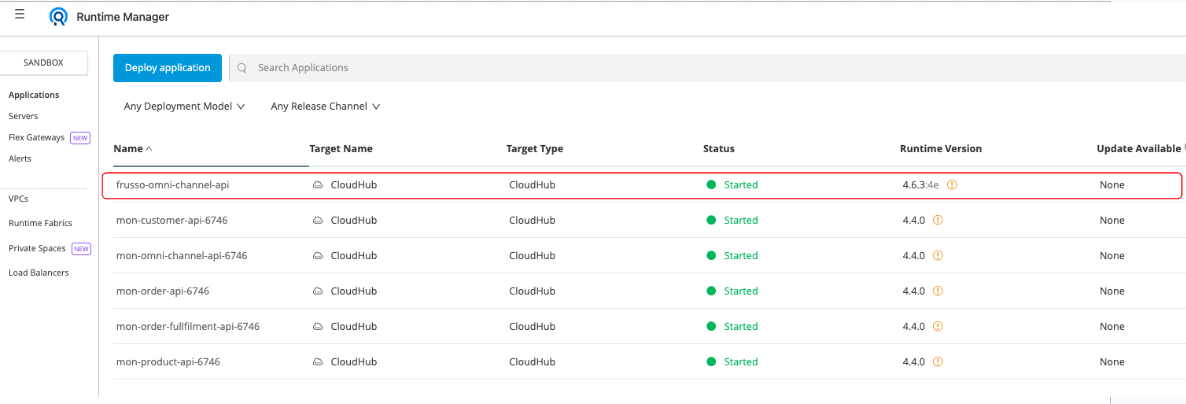
Go to Runtime Manager.
-
Select Sandbox environment.
-
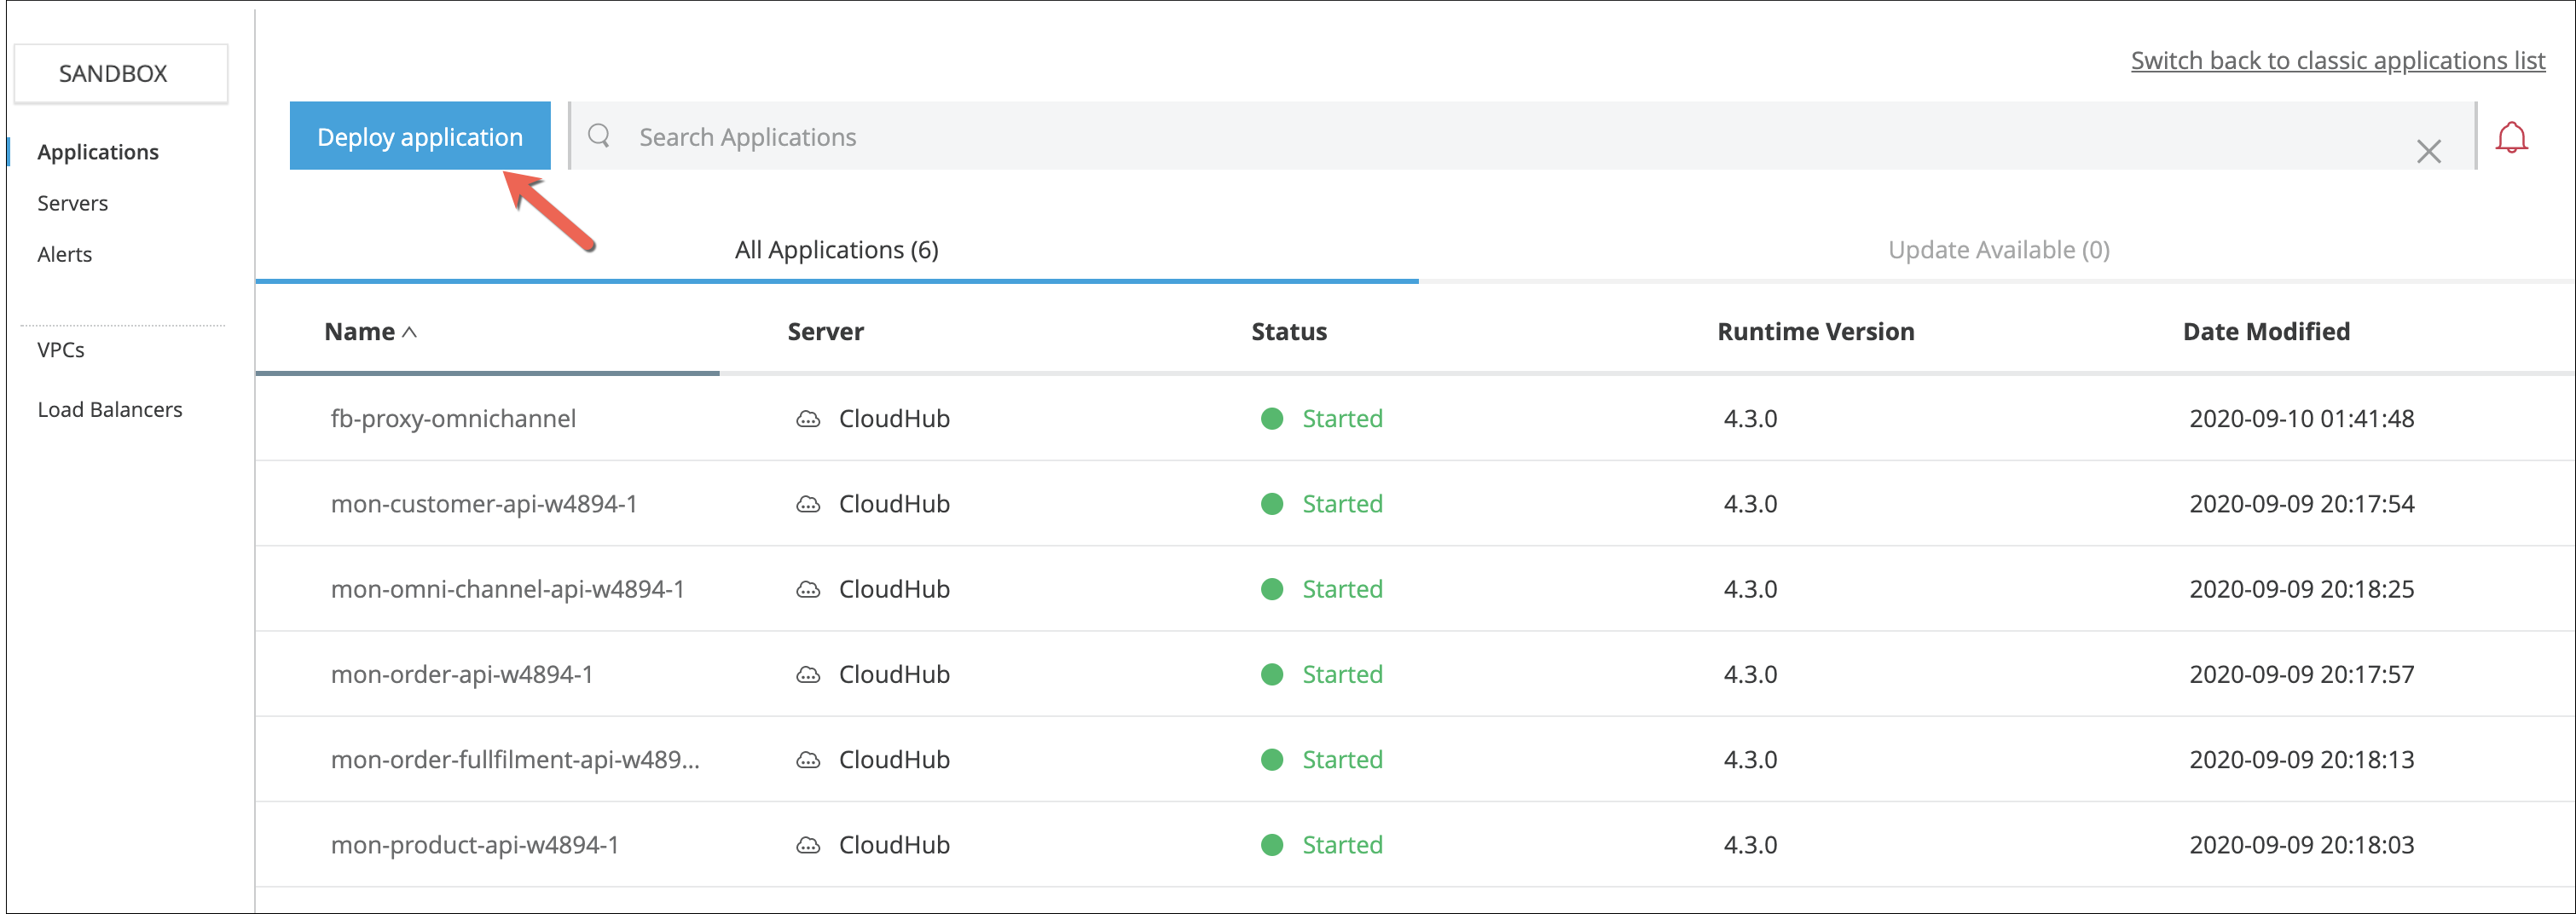
Take a look to the Mule applications deployed.
All of them, ends with a number. Take note of that number, which is going to be needed on next steps.
-
Press Deploy applicaton Button
-
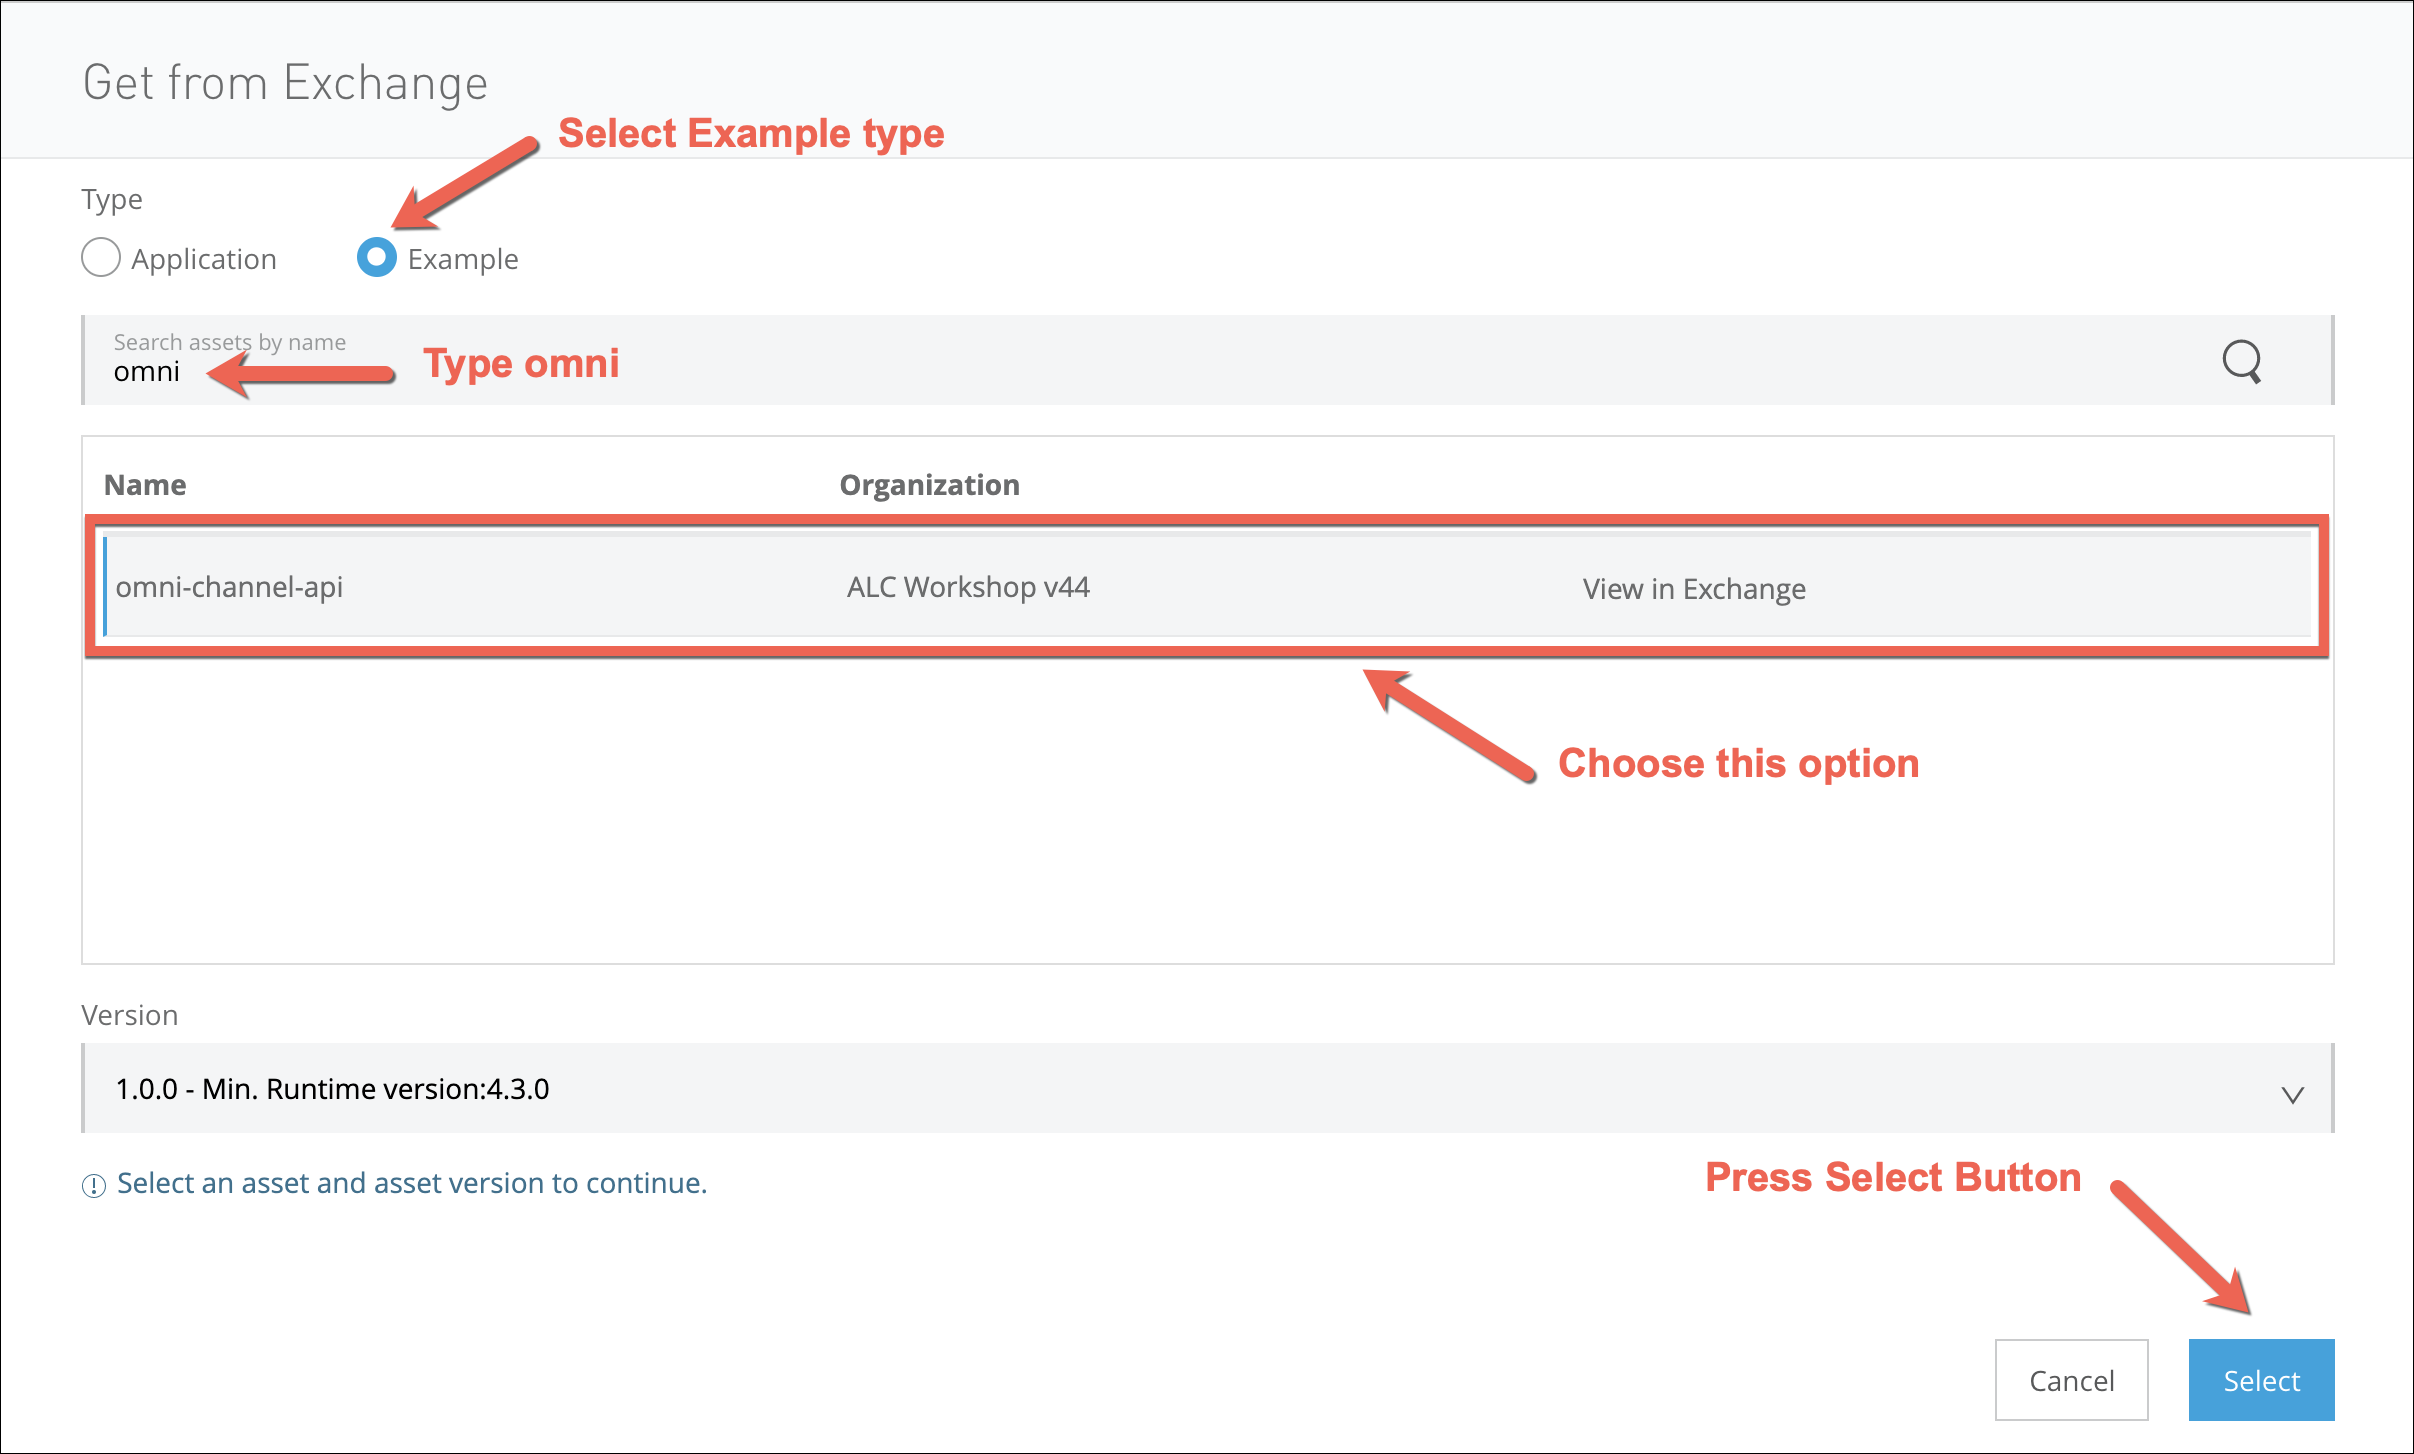
On the next screen, press the Choose file button and select Import file from Exchange
-
On the next page select the Example Type.
-
In the search asset name type
omni -
Select the
omni-channel-apioption. -
Finally press Select
-
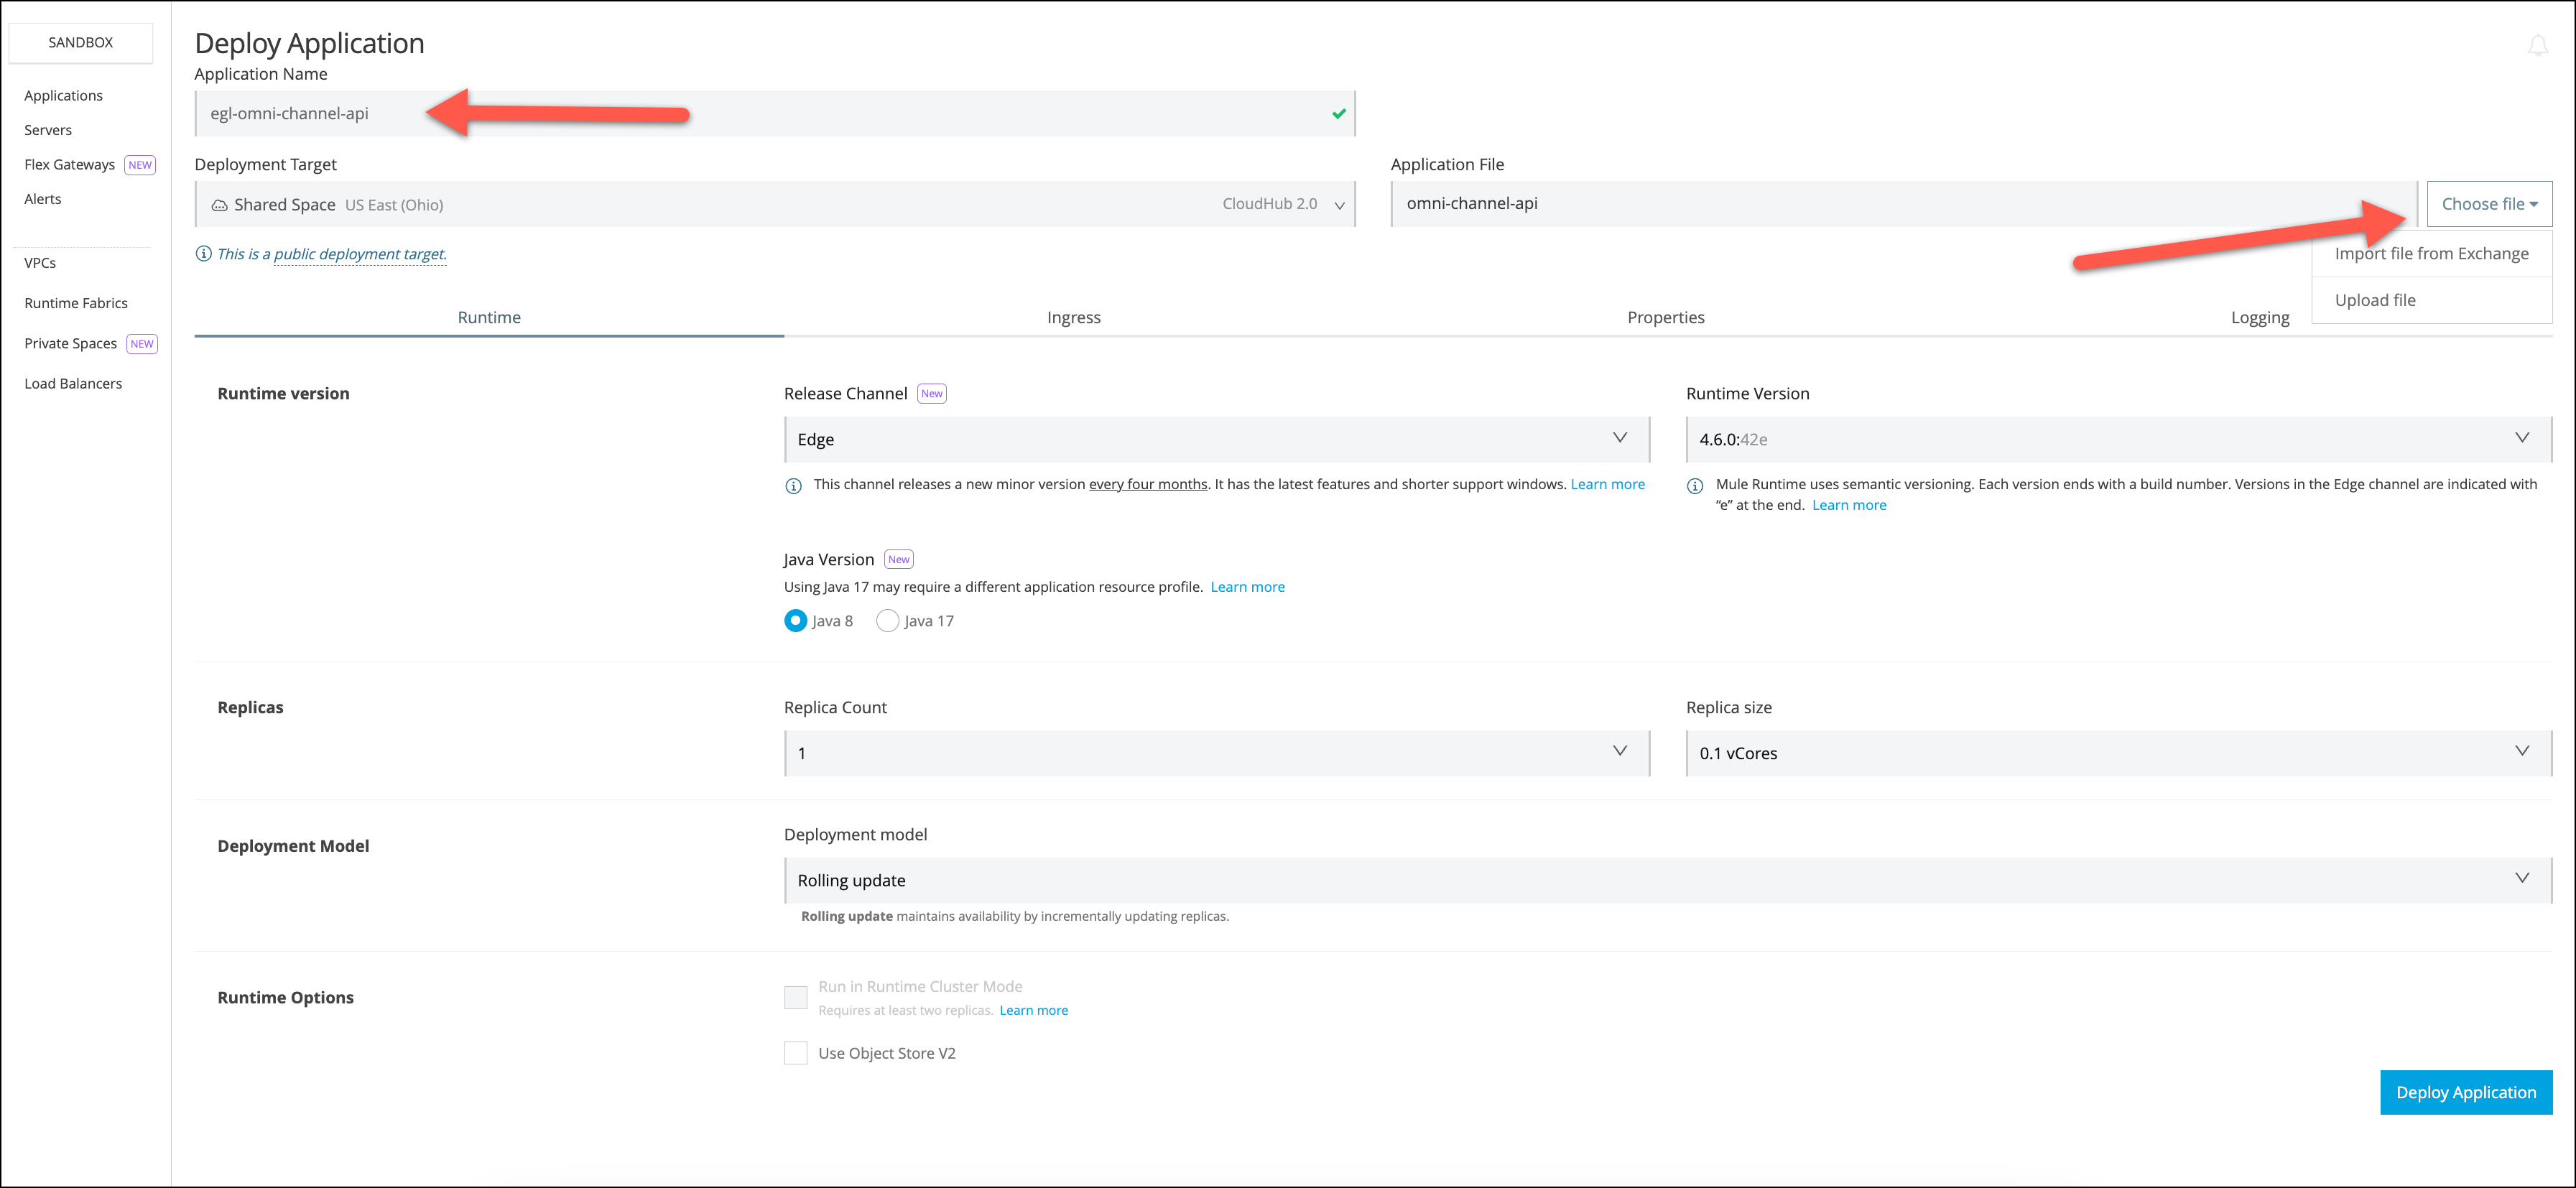
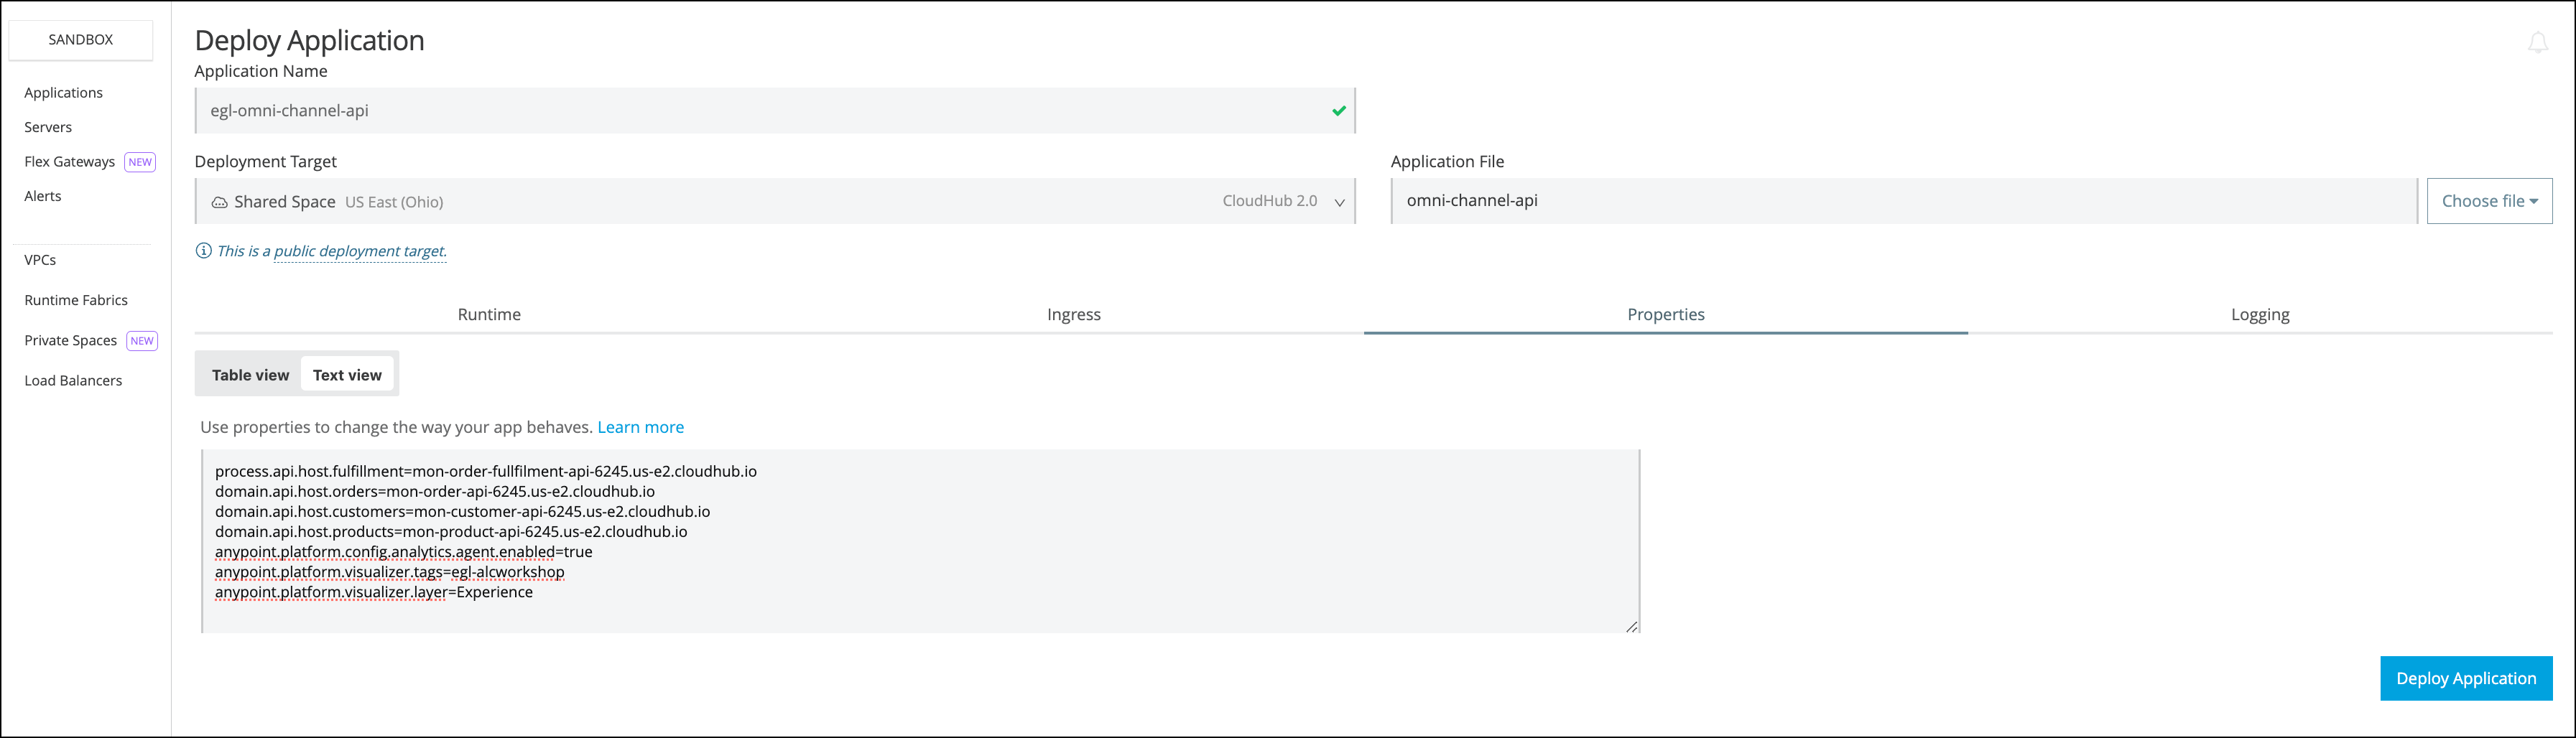
Complete the application name with
<name>-omni-channel-api. Replace <name> with your initials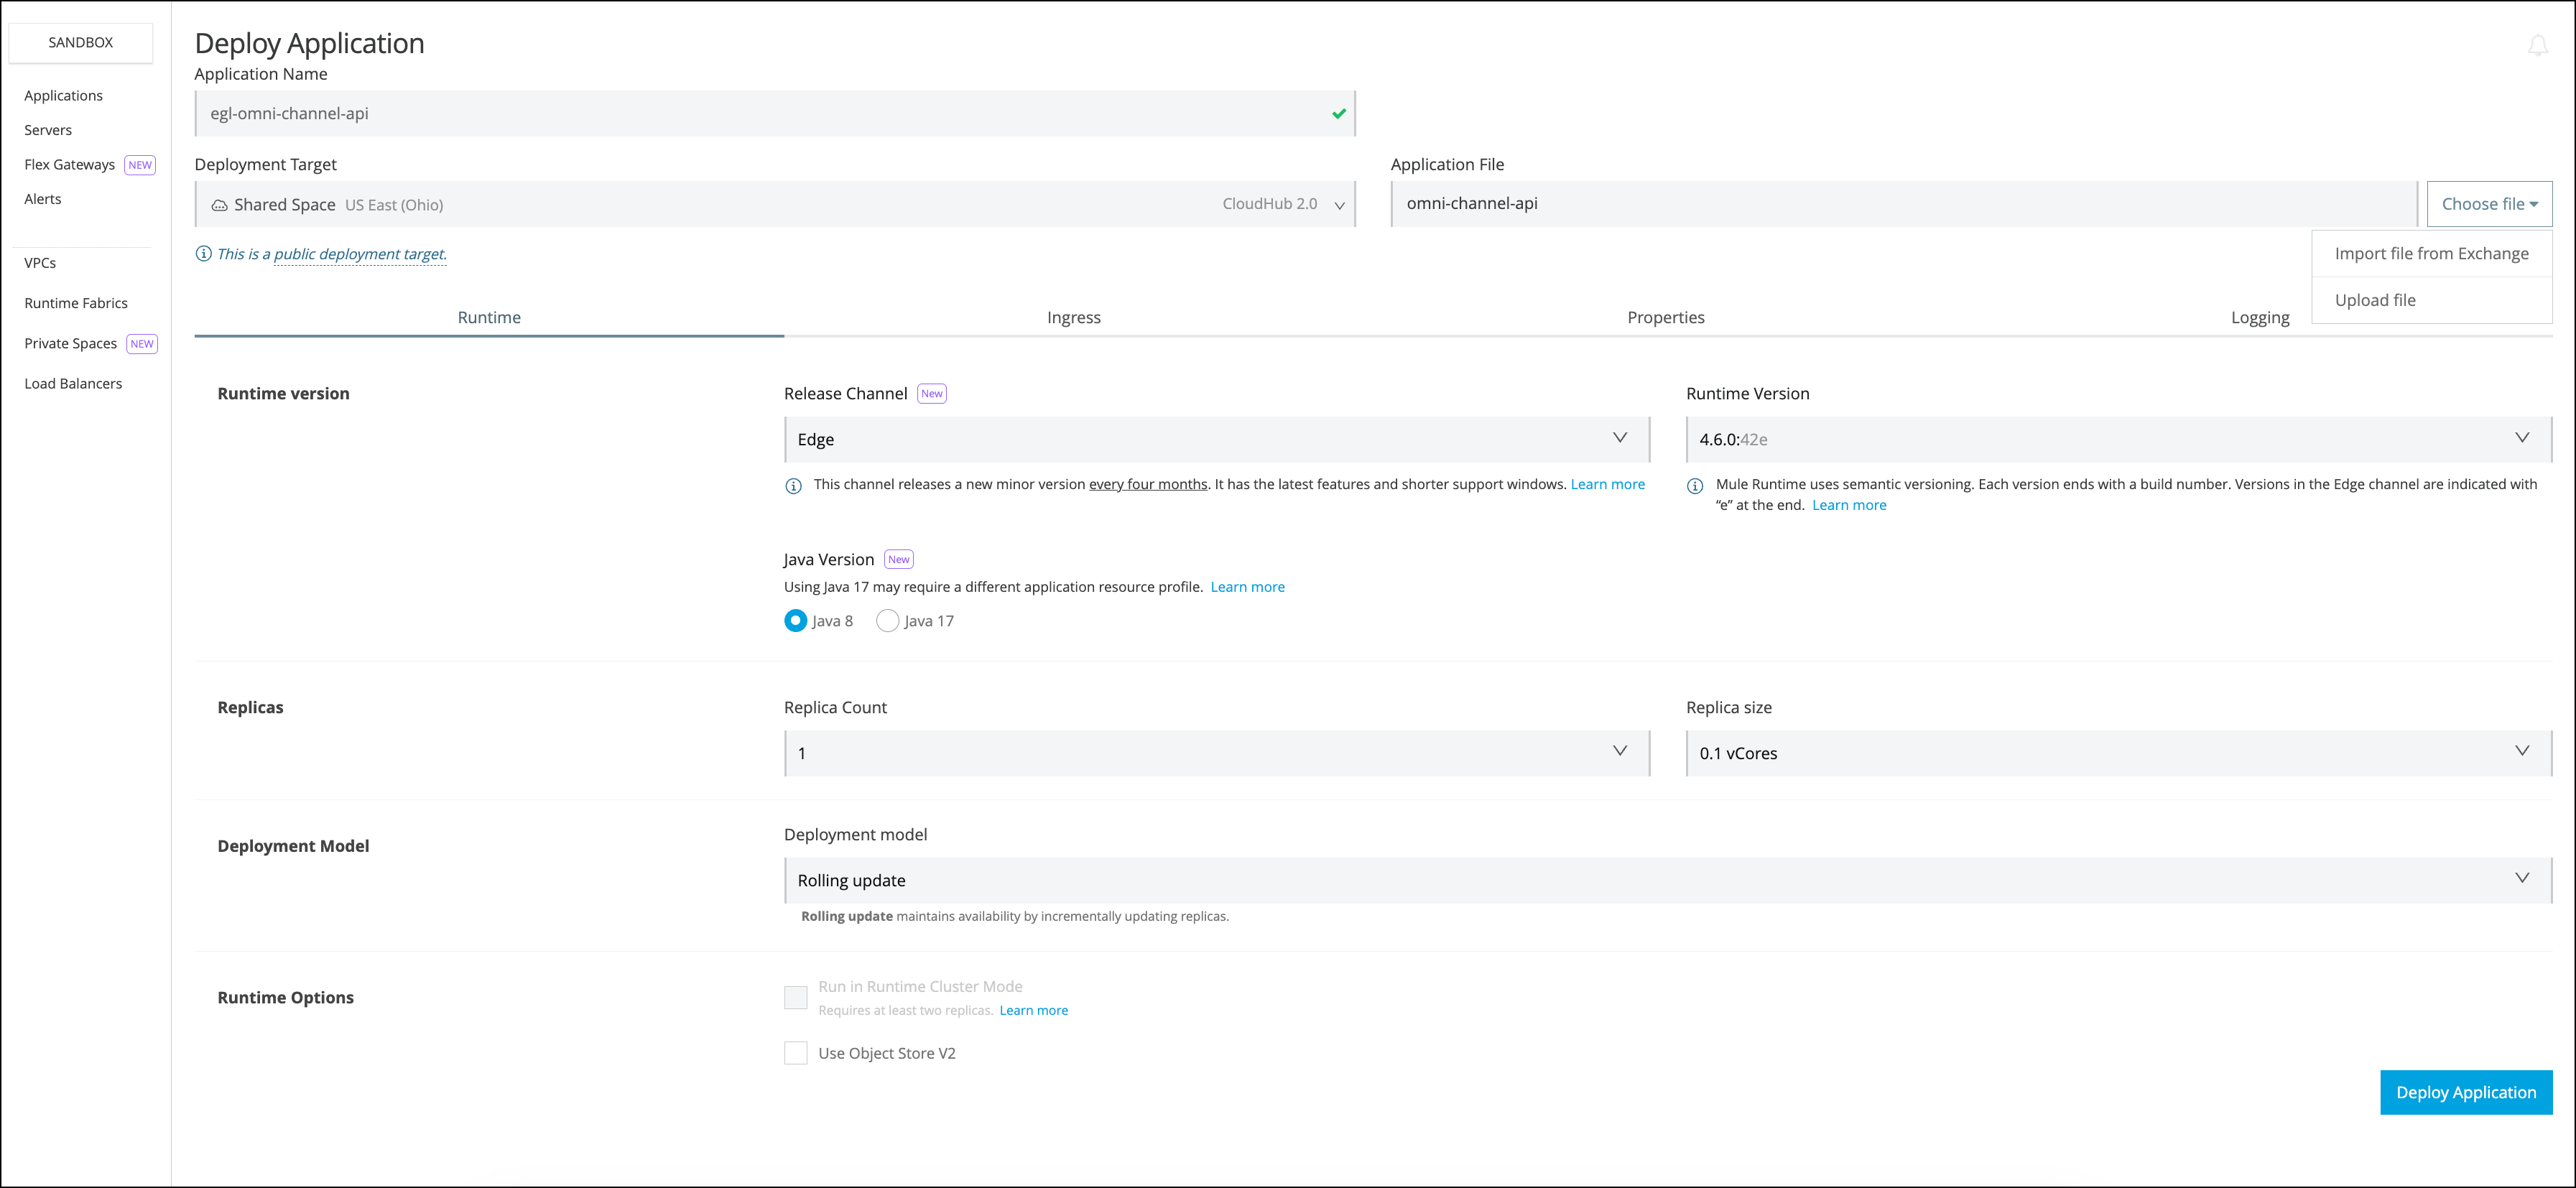 Figure 7. You should see something similar to this (do not change the rest of the default values).
 -
Go to the Properties Tab
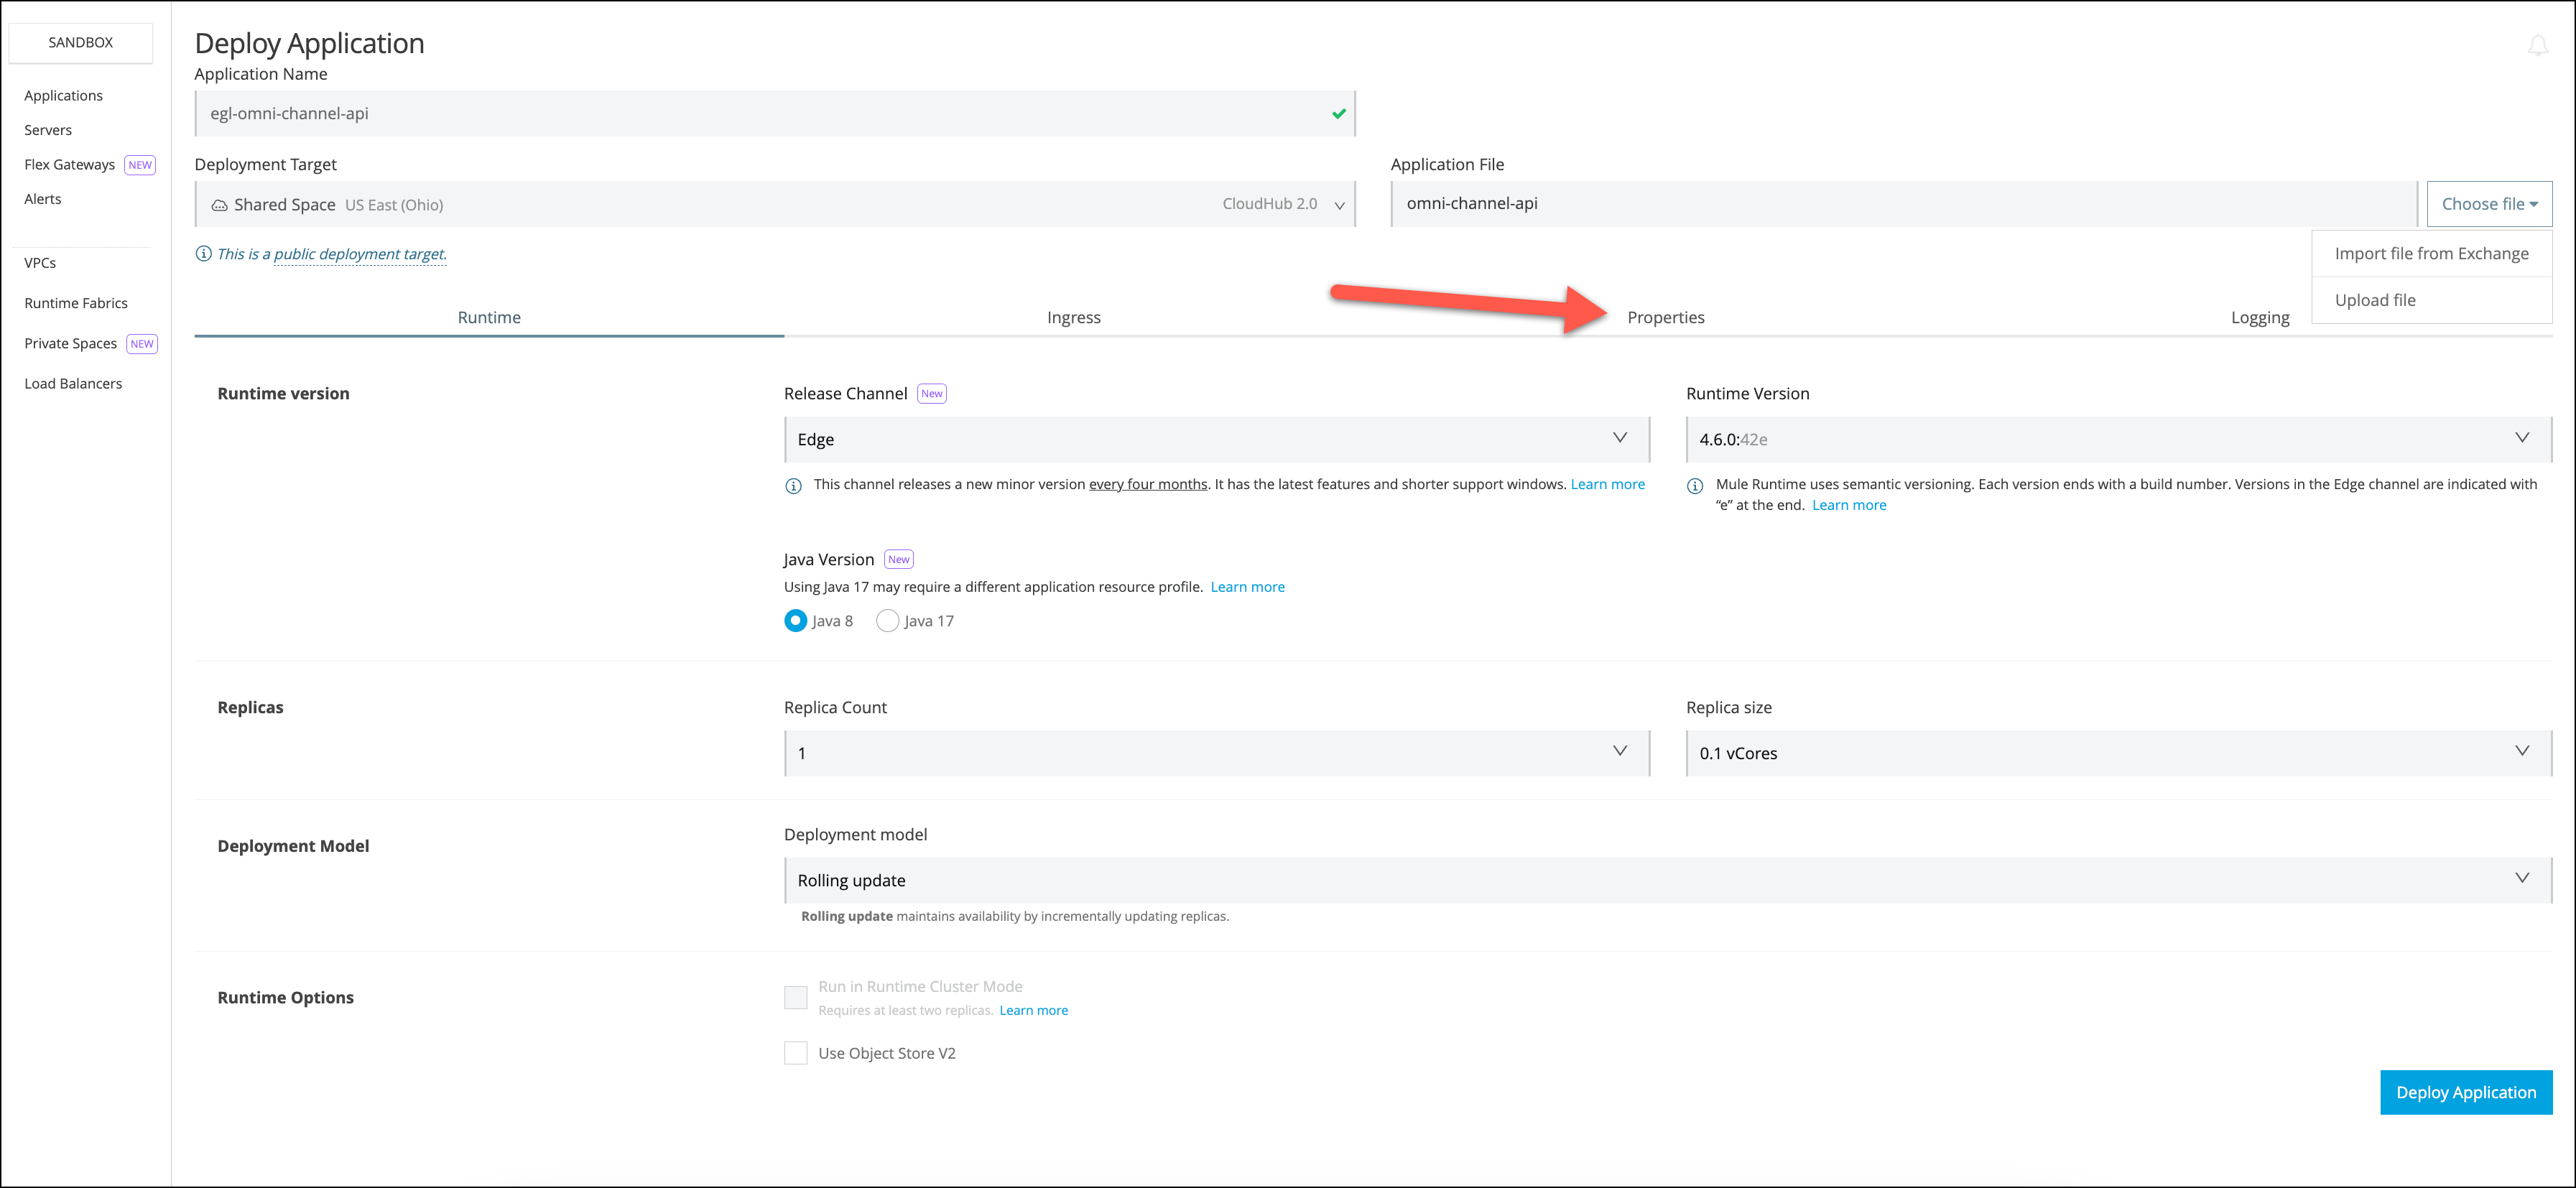
-
Choose the Text View
-
Copy and paste the following Properties
process.api.host.fulfillment=mon-order-fullfilment-api-<id>.us-e2.cloudhub.io
domain.api.host.orders=mon-order-api-<id>.us-e2.cloudhub.io
domain.api.host.customers=mon-customer-api-<id>.us-e2.cloudhub.io
domain.api.host.products=mon-product-api-<id>.us-e2.cloudhub.io
anypoint.platform.config.analytics.agent.enabled=true
anypoint.platform.visualizer.tags=<name>-alcworkshop
anypoint.platform.visualizer.layer=Experience
Replace <id> with the number you took note of at the beginning
Replace
<name>with your initials in the anypoint.platform.visualizer.tags property.The first four properties are the hostnames of the APIs that are going to be invoked.
The following three properties are Visualizer properties.
-
anypoint.platform.config.analytics.agent.enabled: This enables an agent to send metrics to the platform for monitoring and visualization. Without this parameter the deployed API will not appear in Visualizer and will not be monitored.
-
anypoint.platform.visualizer.tags: This property will help in filtering the API.
-
anypoint.platform.visualizer.layer: This property sets the logical layer in which the API will be displayed.
-
-
Press Deploy Application button.
Once the application is deployed and started.
-
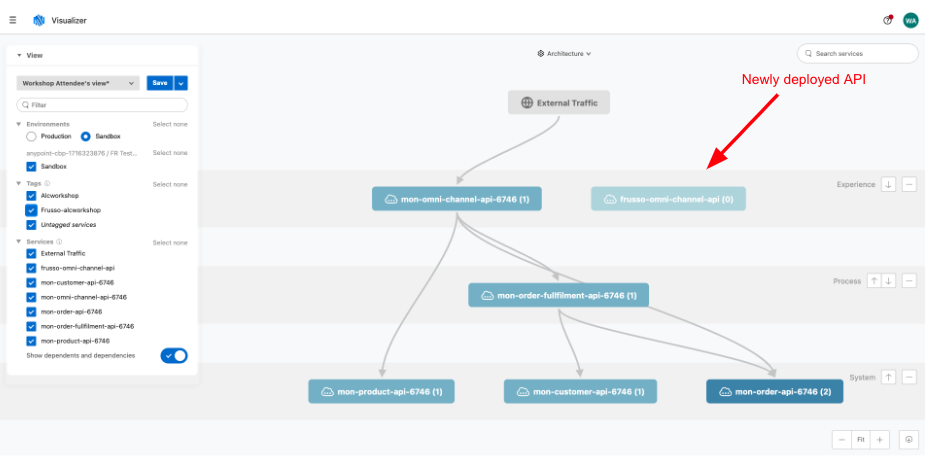
Go back to Anypoint Visualizer
You should see the new deployed application.
If the application doesn’t appear in Visualizer, confirm the tag you configured in the previous step is selected. -
To save the view with the applied filters, Press the save button.
In the next step we are going to stress this API and see the metrics online.
Step 3: Stress the API
In this step you are going to stress the API already deployed and see how the metrics change over time.
We are going to import a collection of requests in Postman and run it several times.
If you don’t have Postman installed, you can get it from here
-
Download the postman scripts from here
-
Double-click to open the zip. Inside, you will find two files:
-
omni-channel.postman_collection.json
-
alc-workshop.postman_environment.json
-
-
Open Postman

-
Press the Import button on the top.
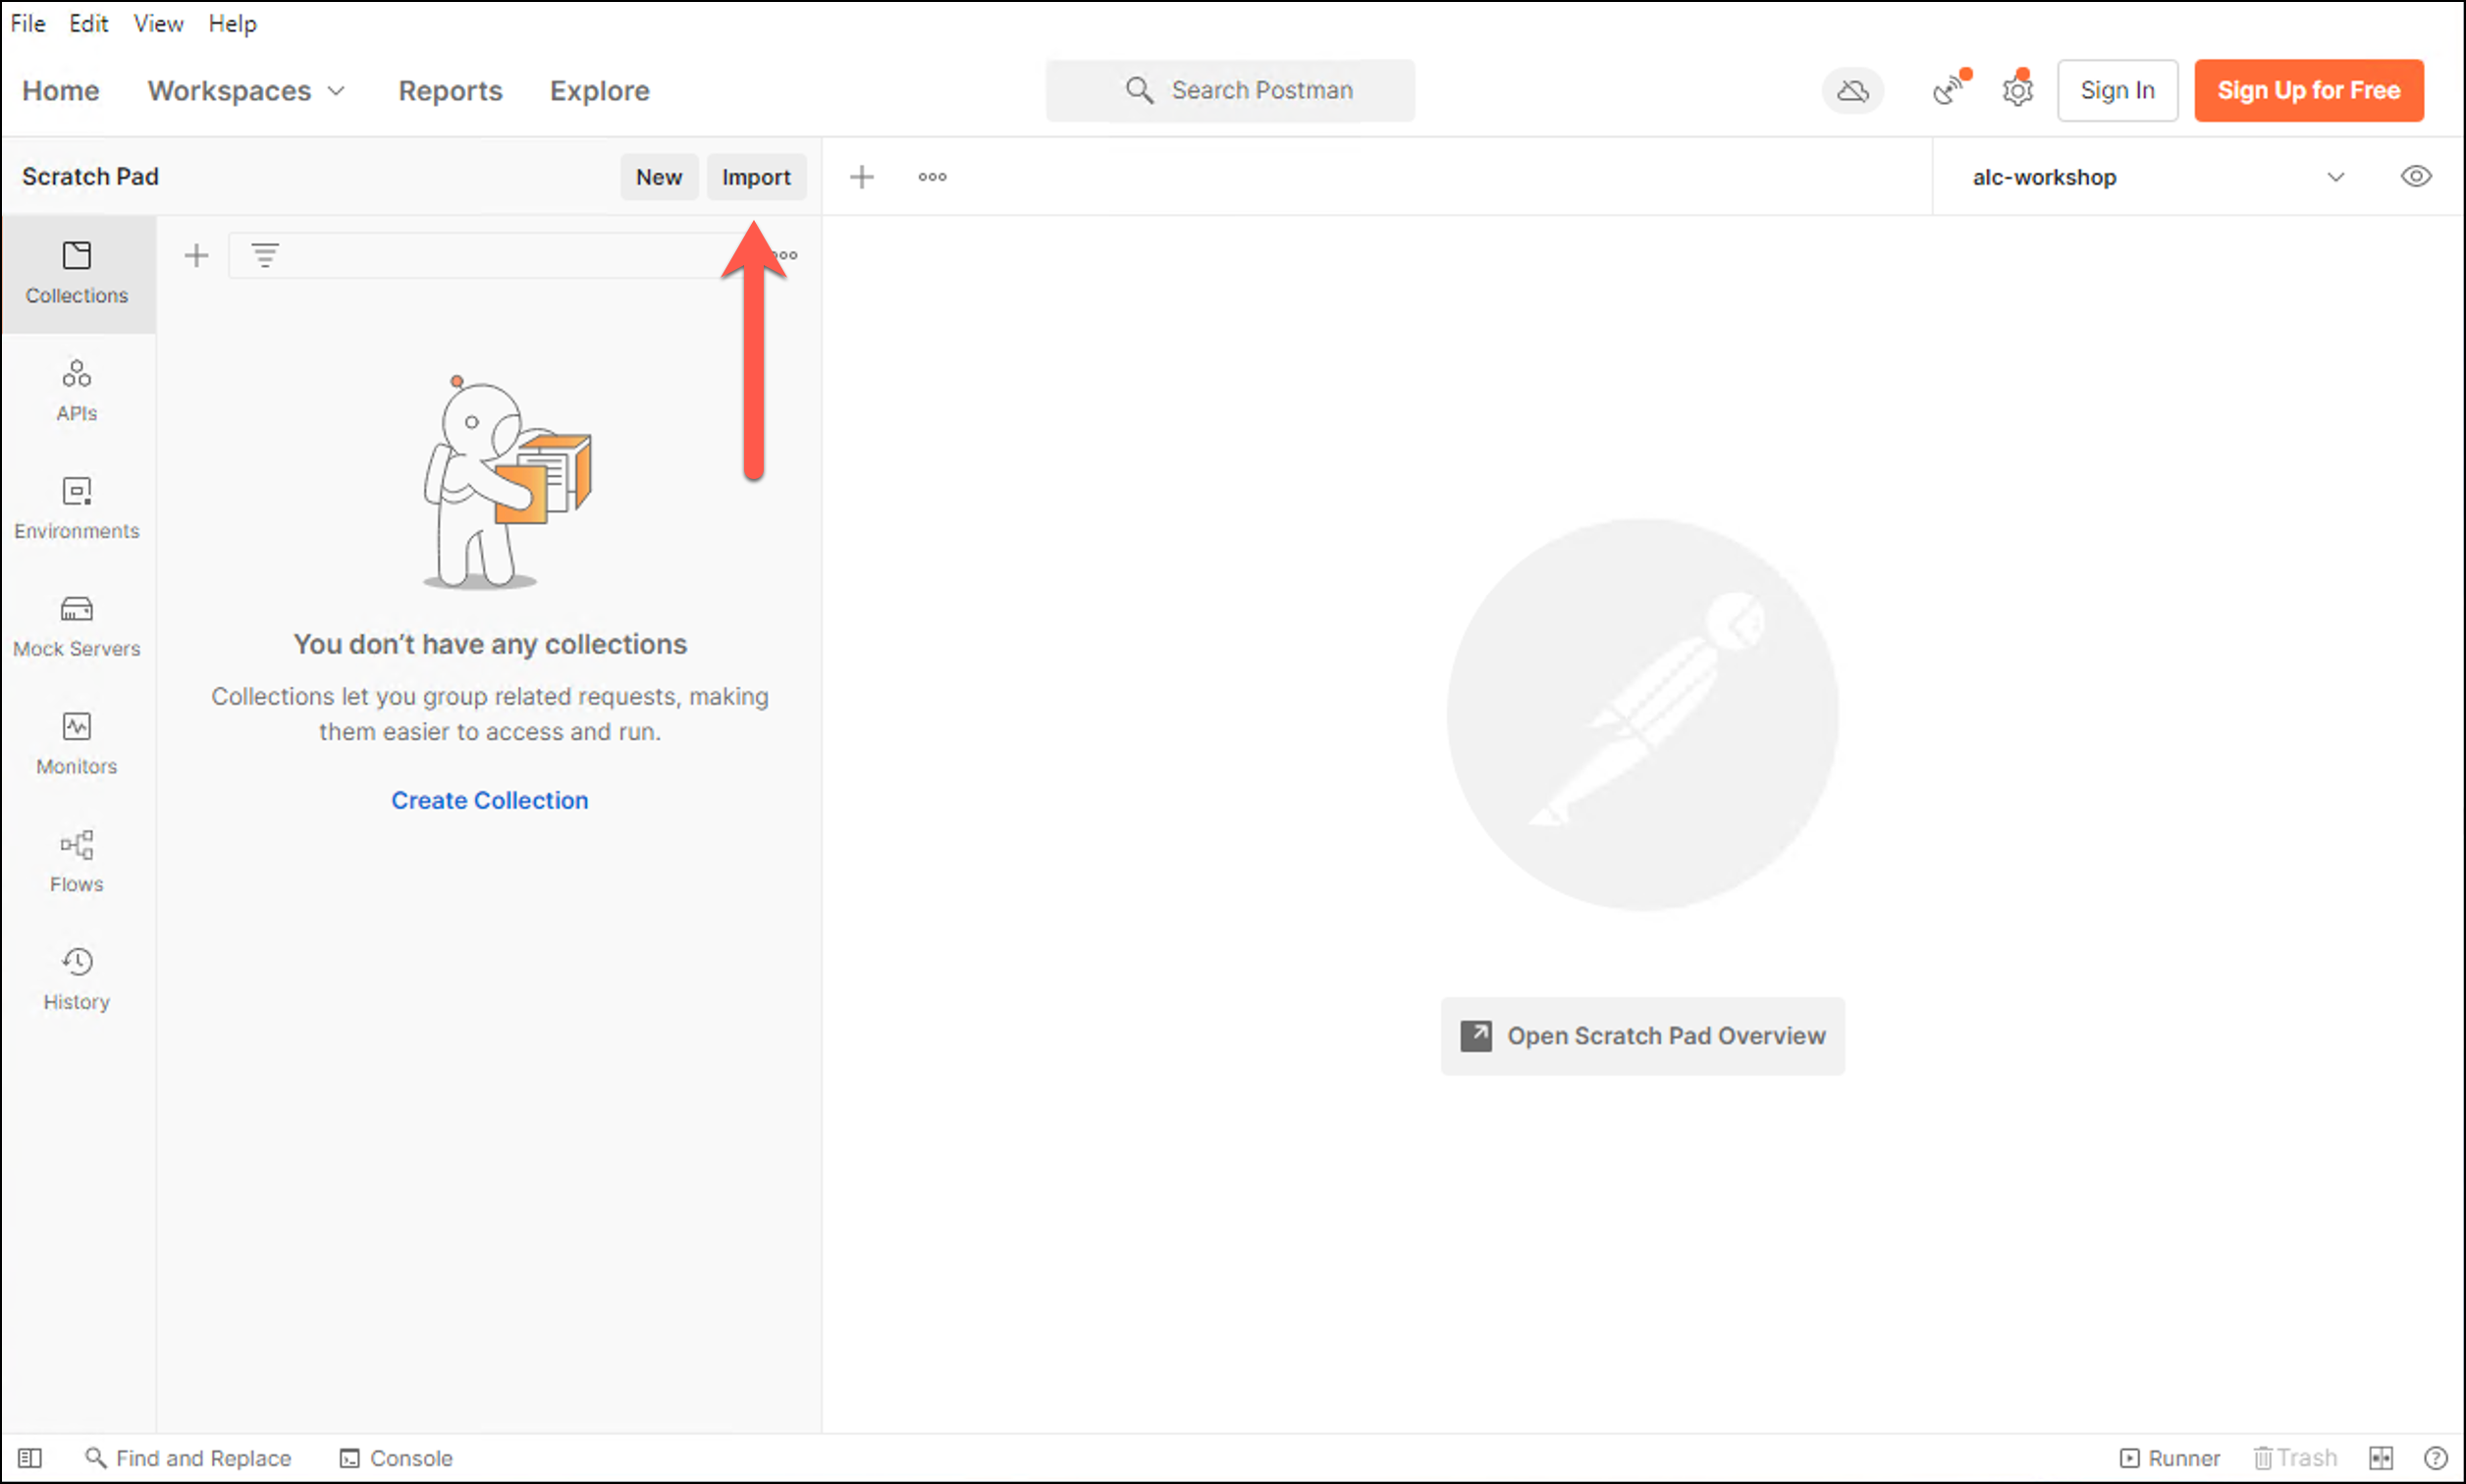
-
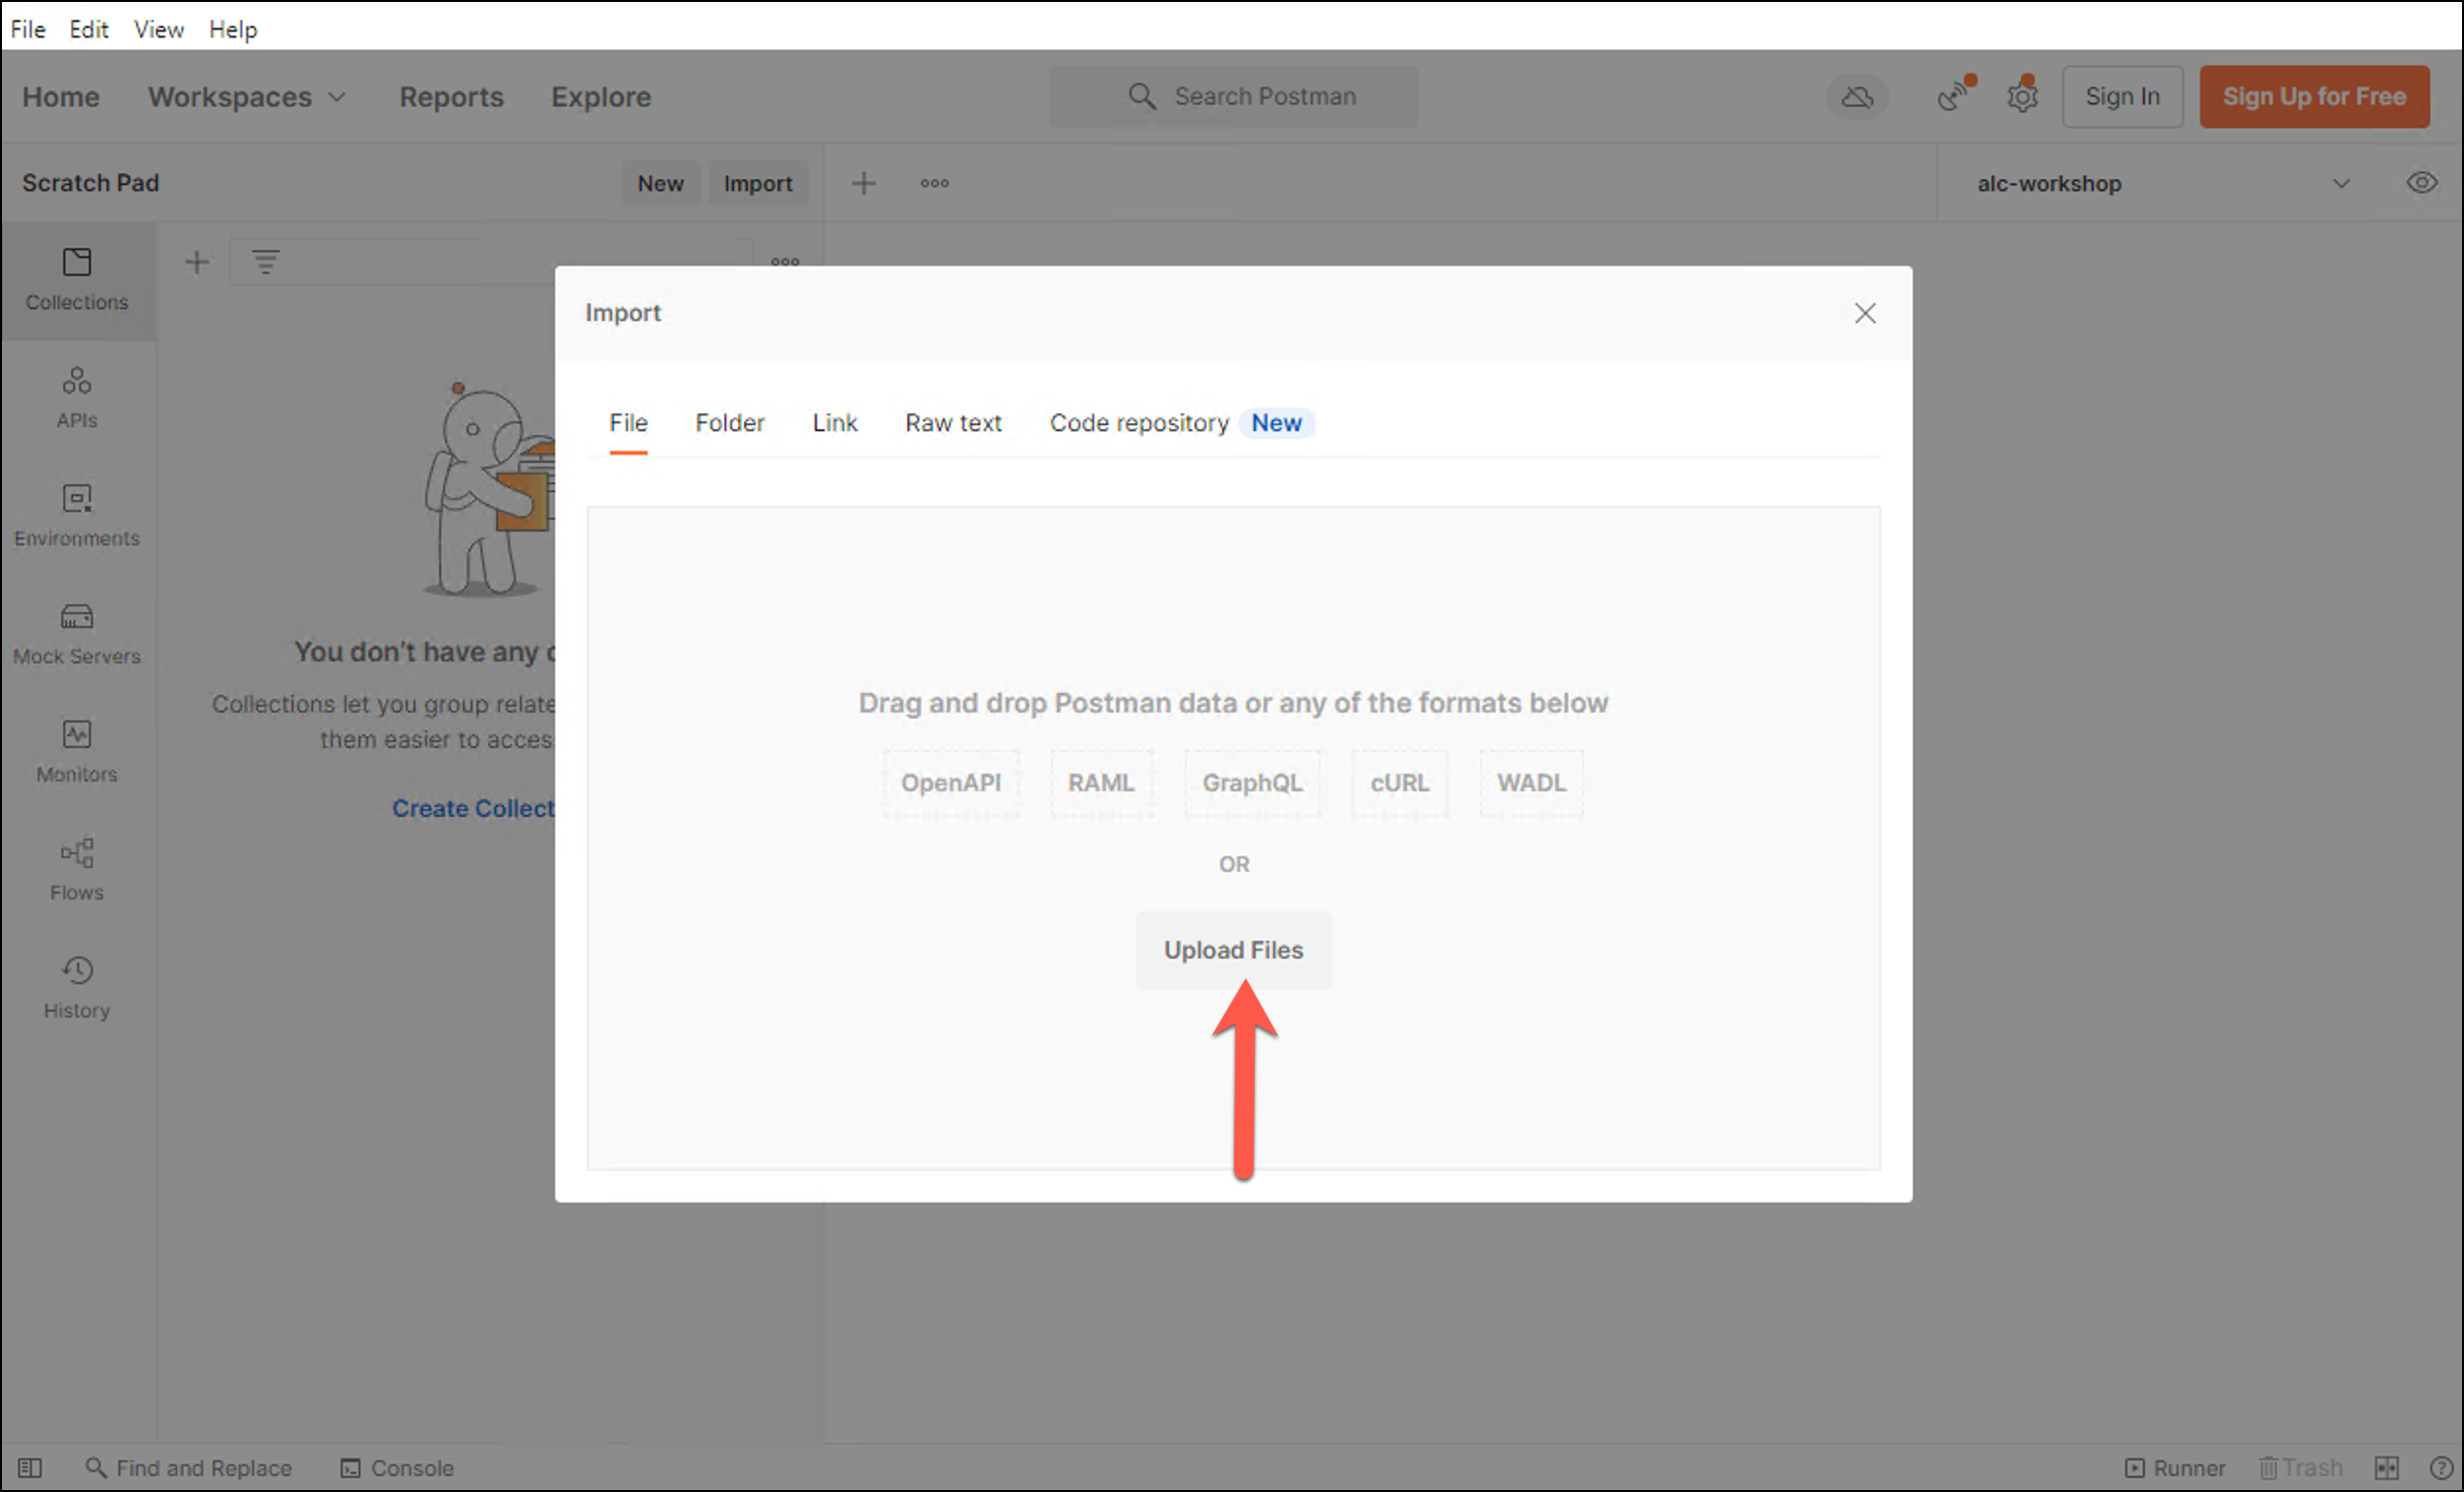
Select the Upload Files button
-
A new screen will open. Import the file
omni-channel.postman_collection.json.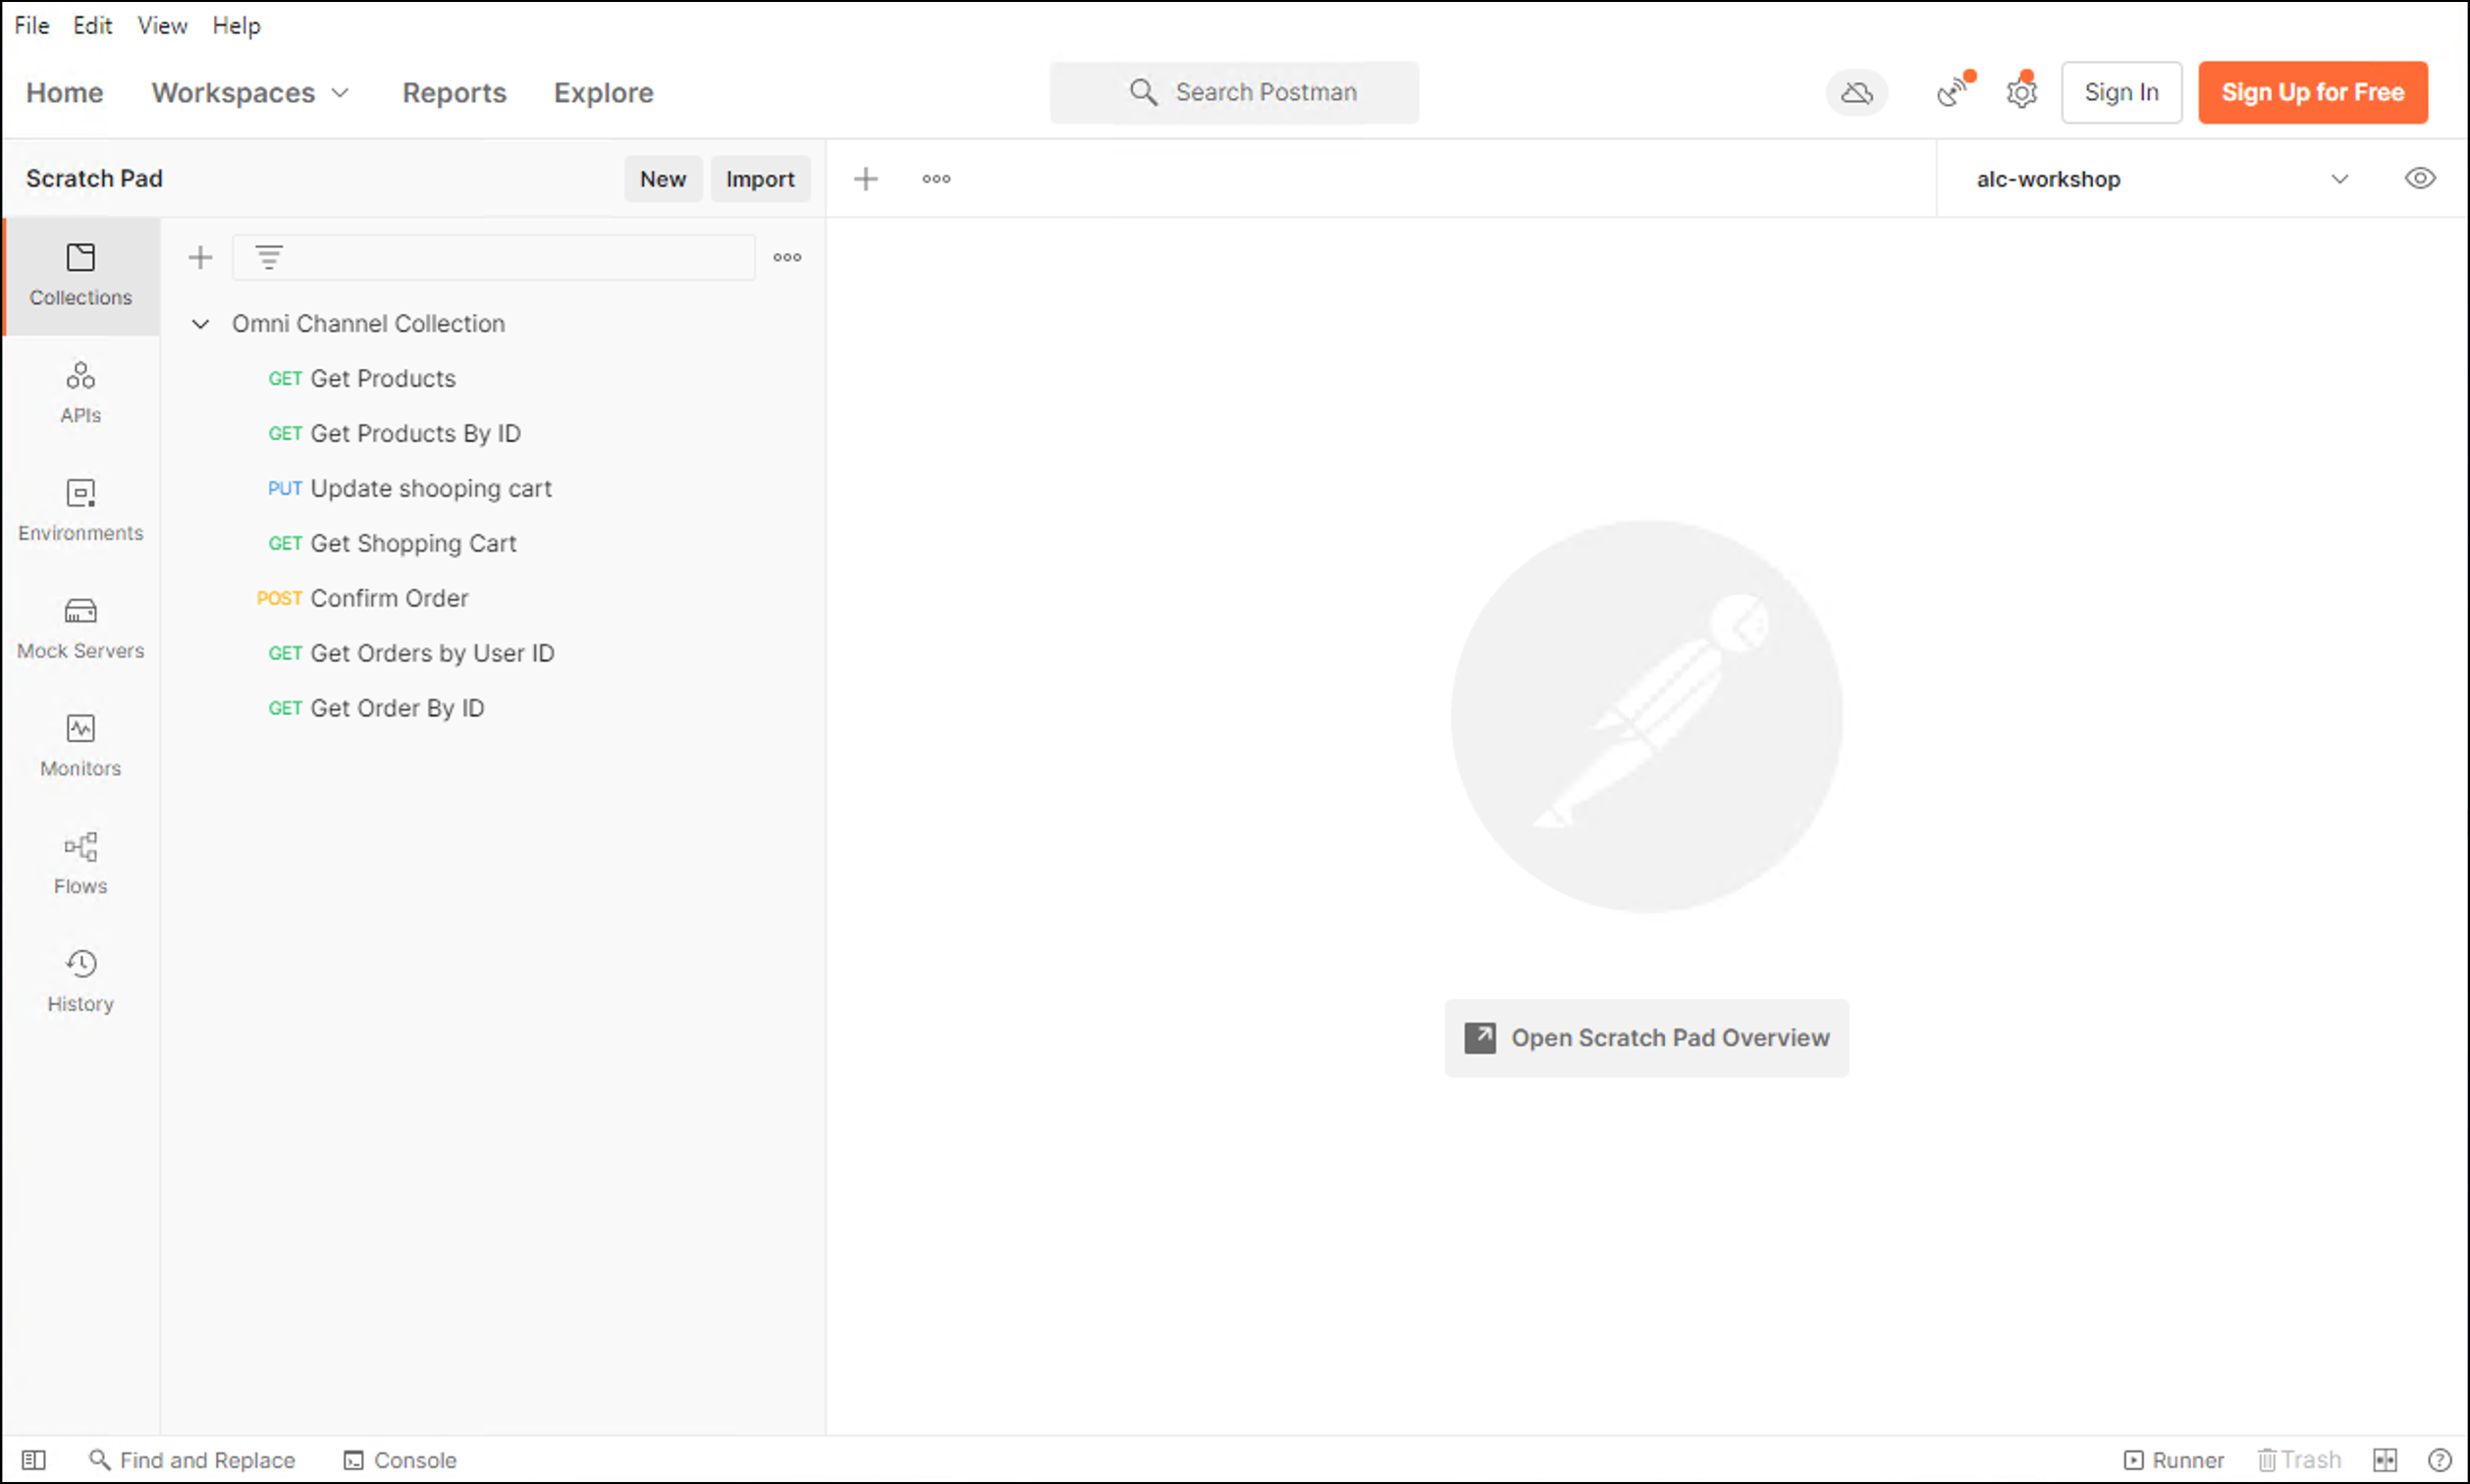 Figure 8. You should see 7 Requests imported on the left.
 -
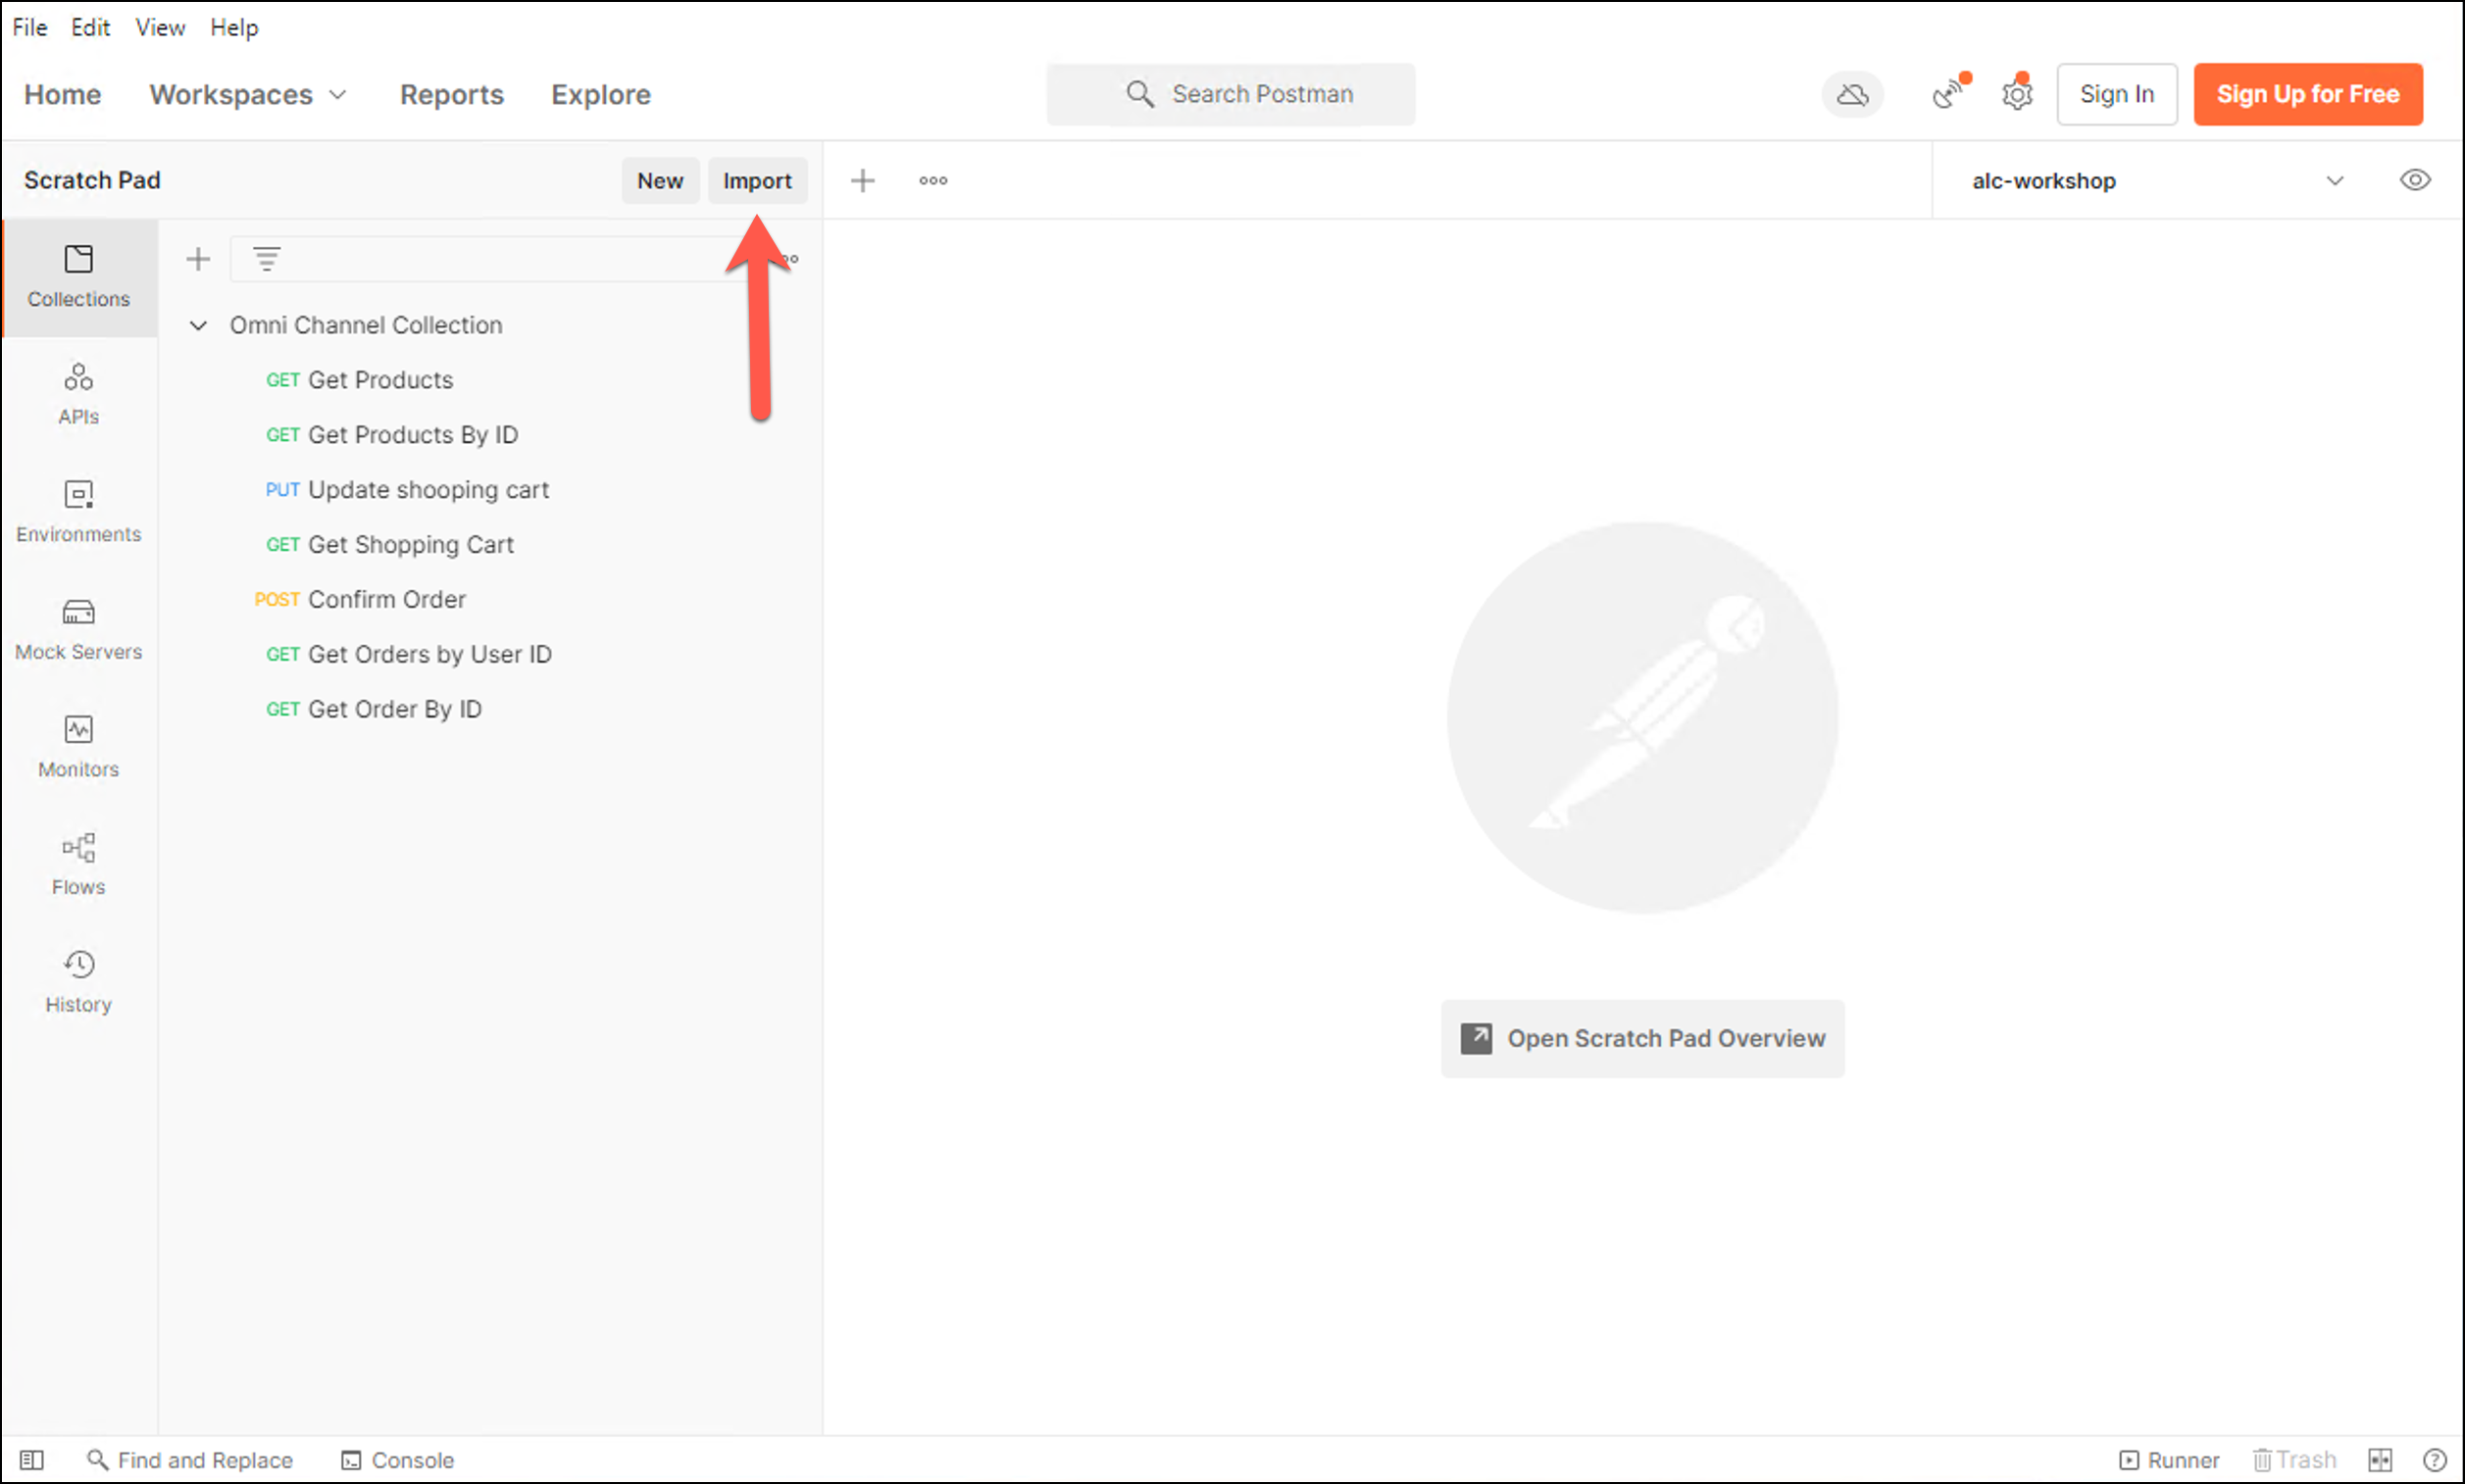
Now we are going to import an environment variable. Go to import again. And select again the Upload Files
-
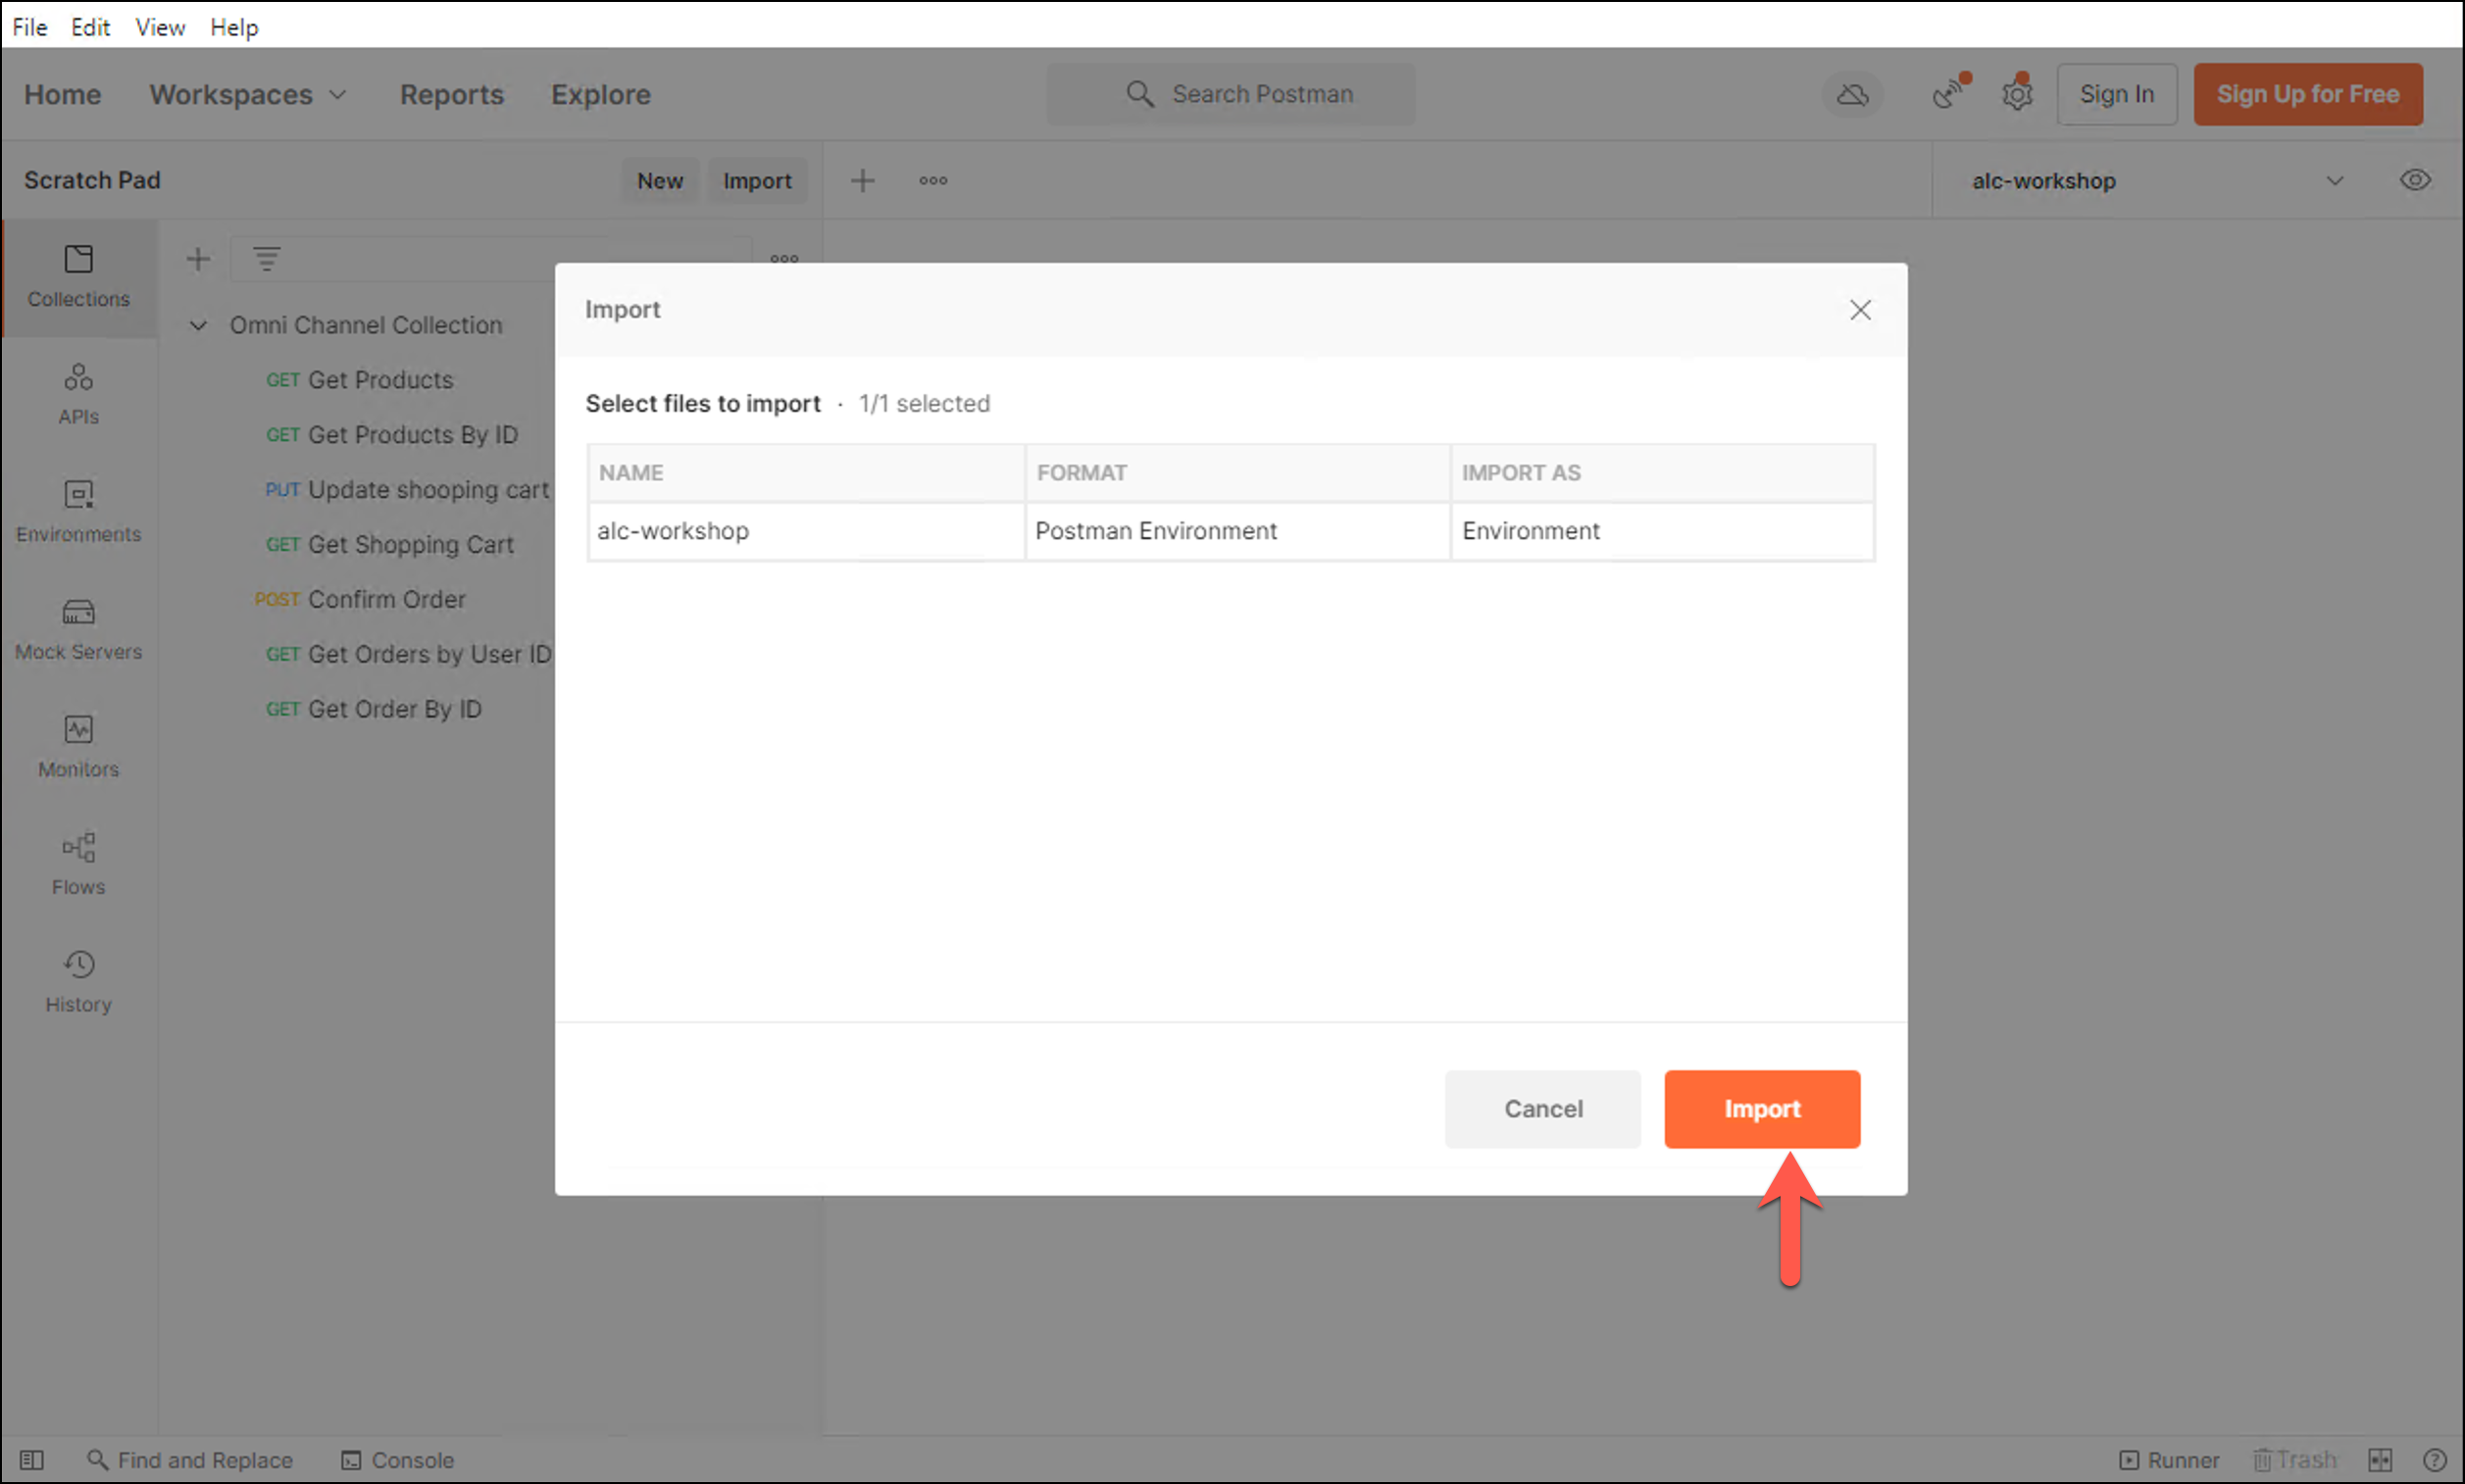
Import the file
alc-workshop.postman_environment.json. -
Press the Import button to finish
-
Now choose the alc-workshop variable from the drop down list to use the environment variable included there.
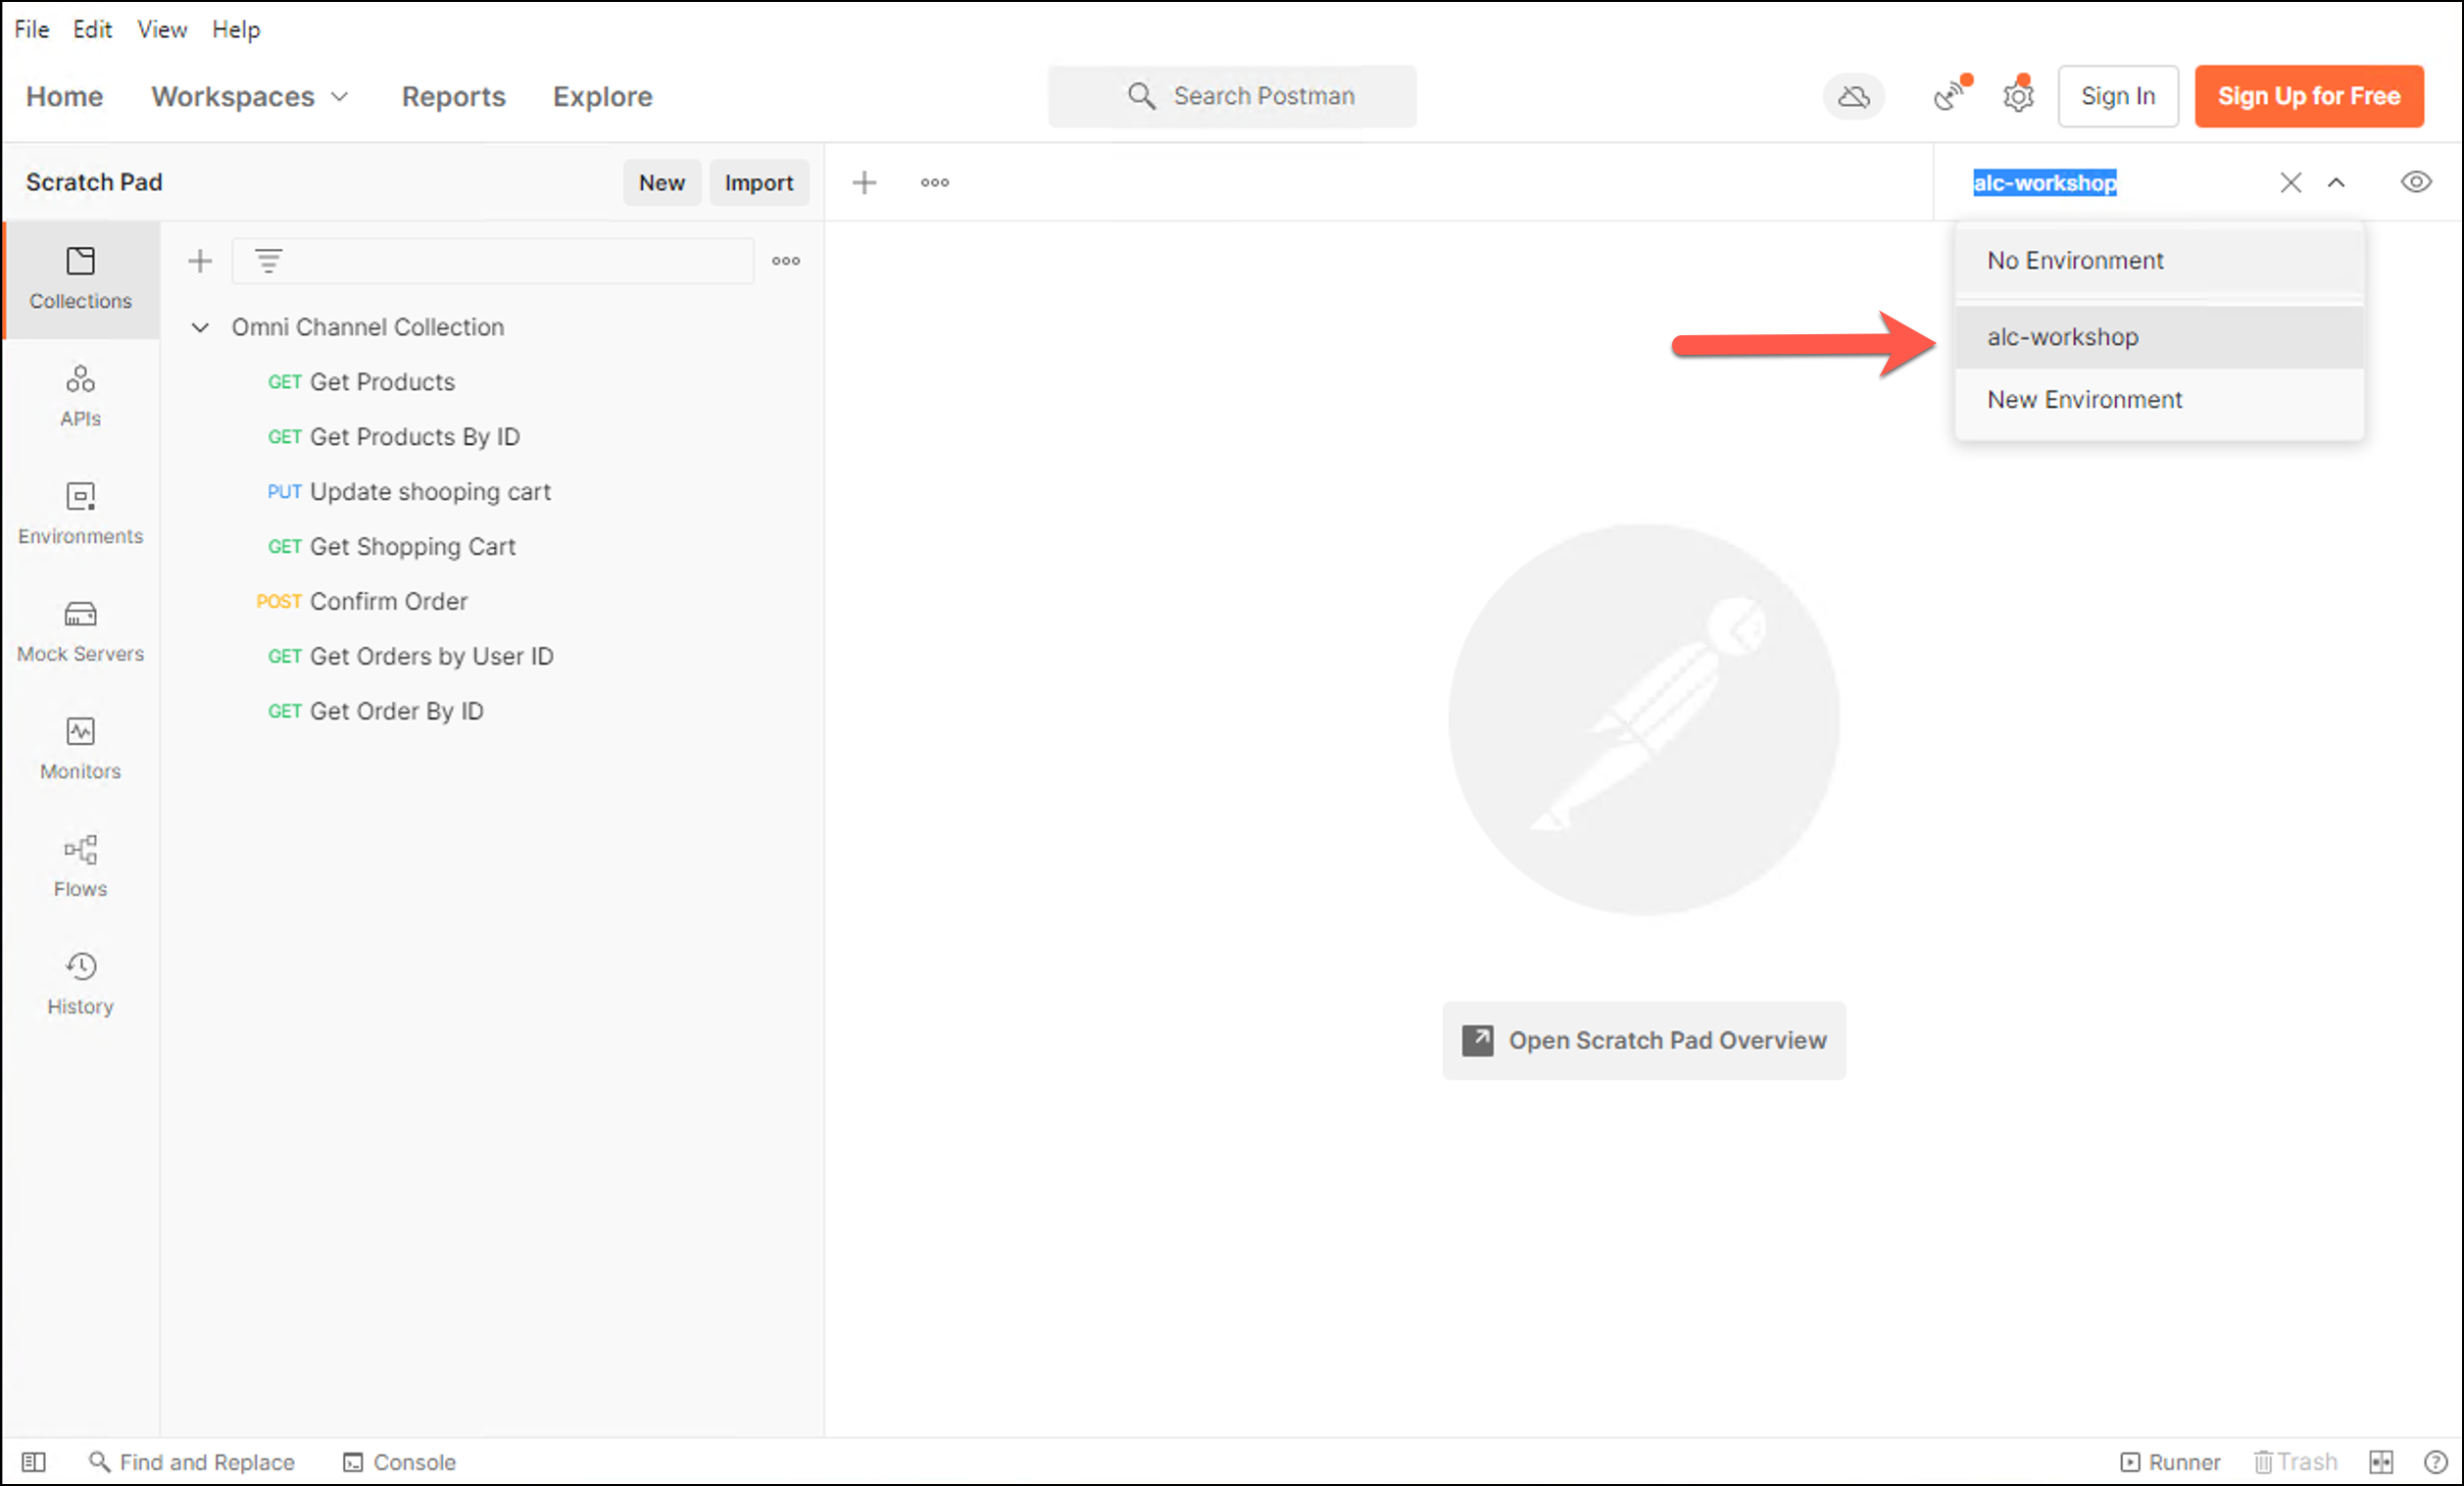
-
Click on the eye at the top right of the screen.
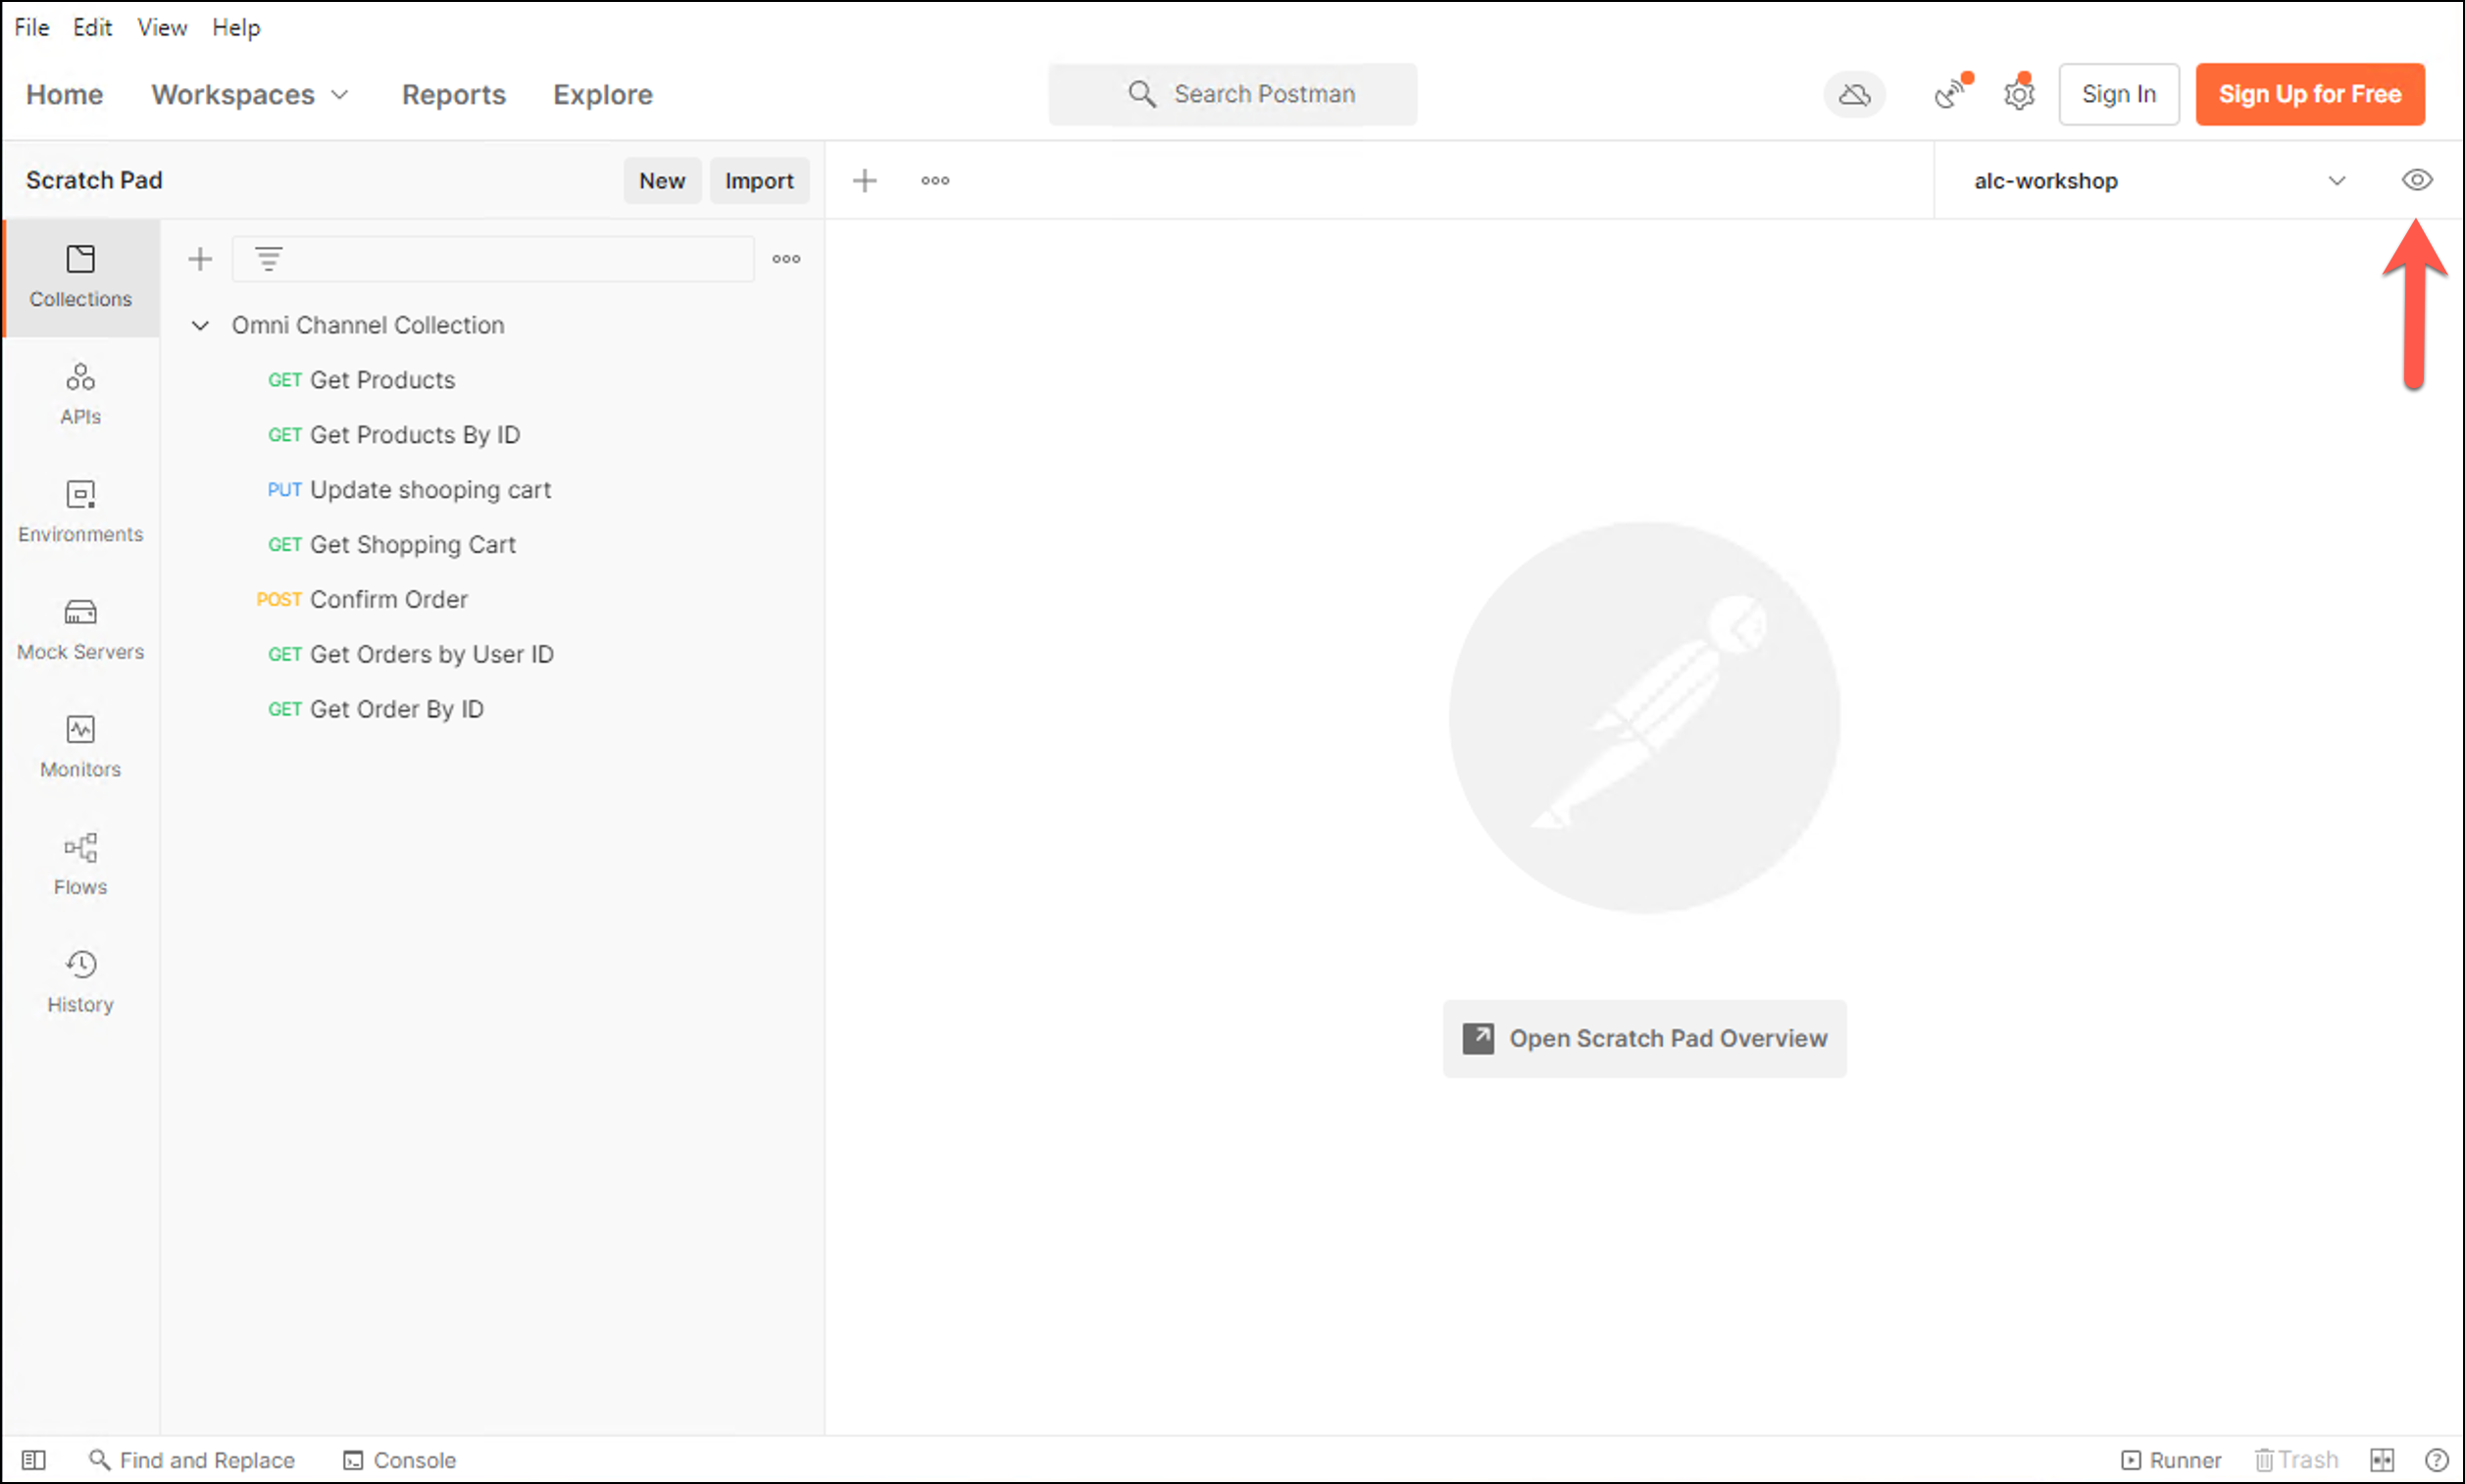
-
Configure the current value (host name in Visualizer).
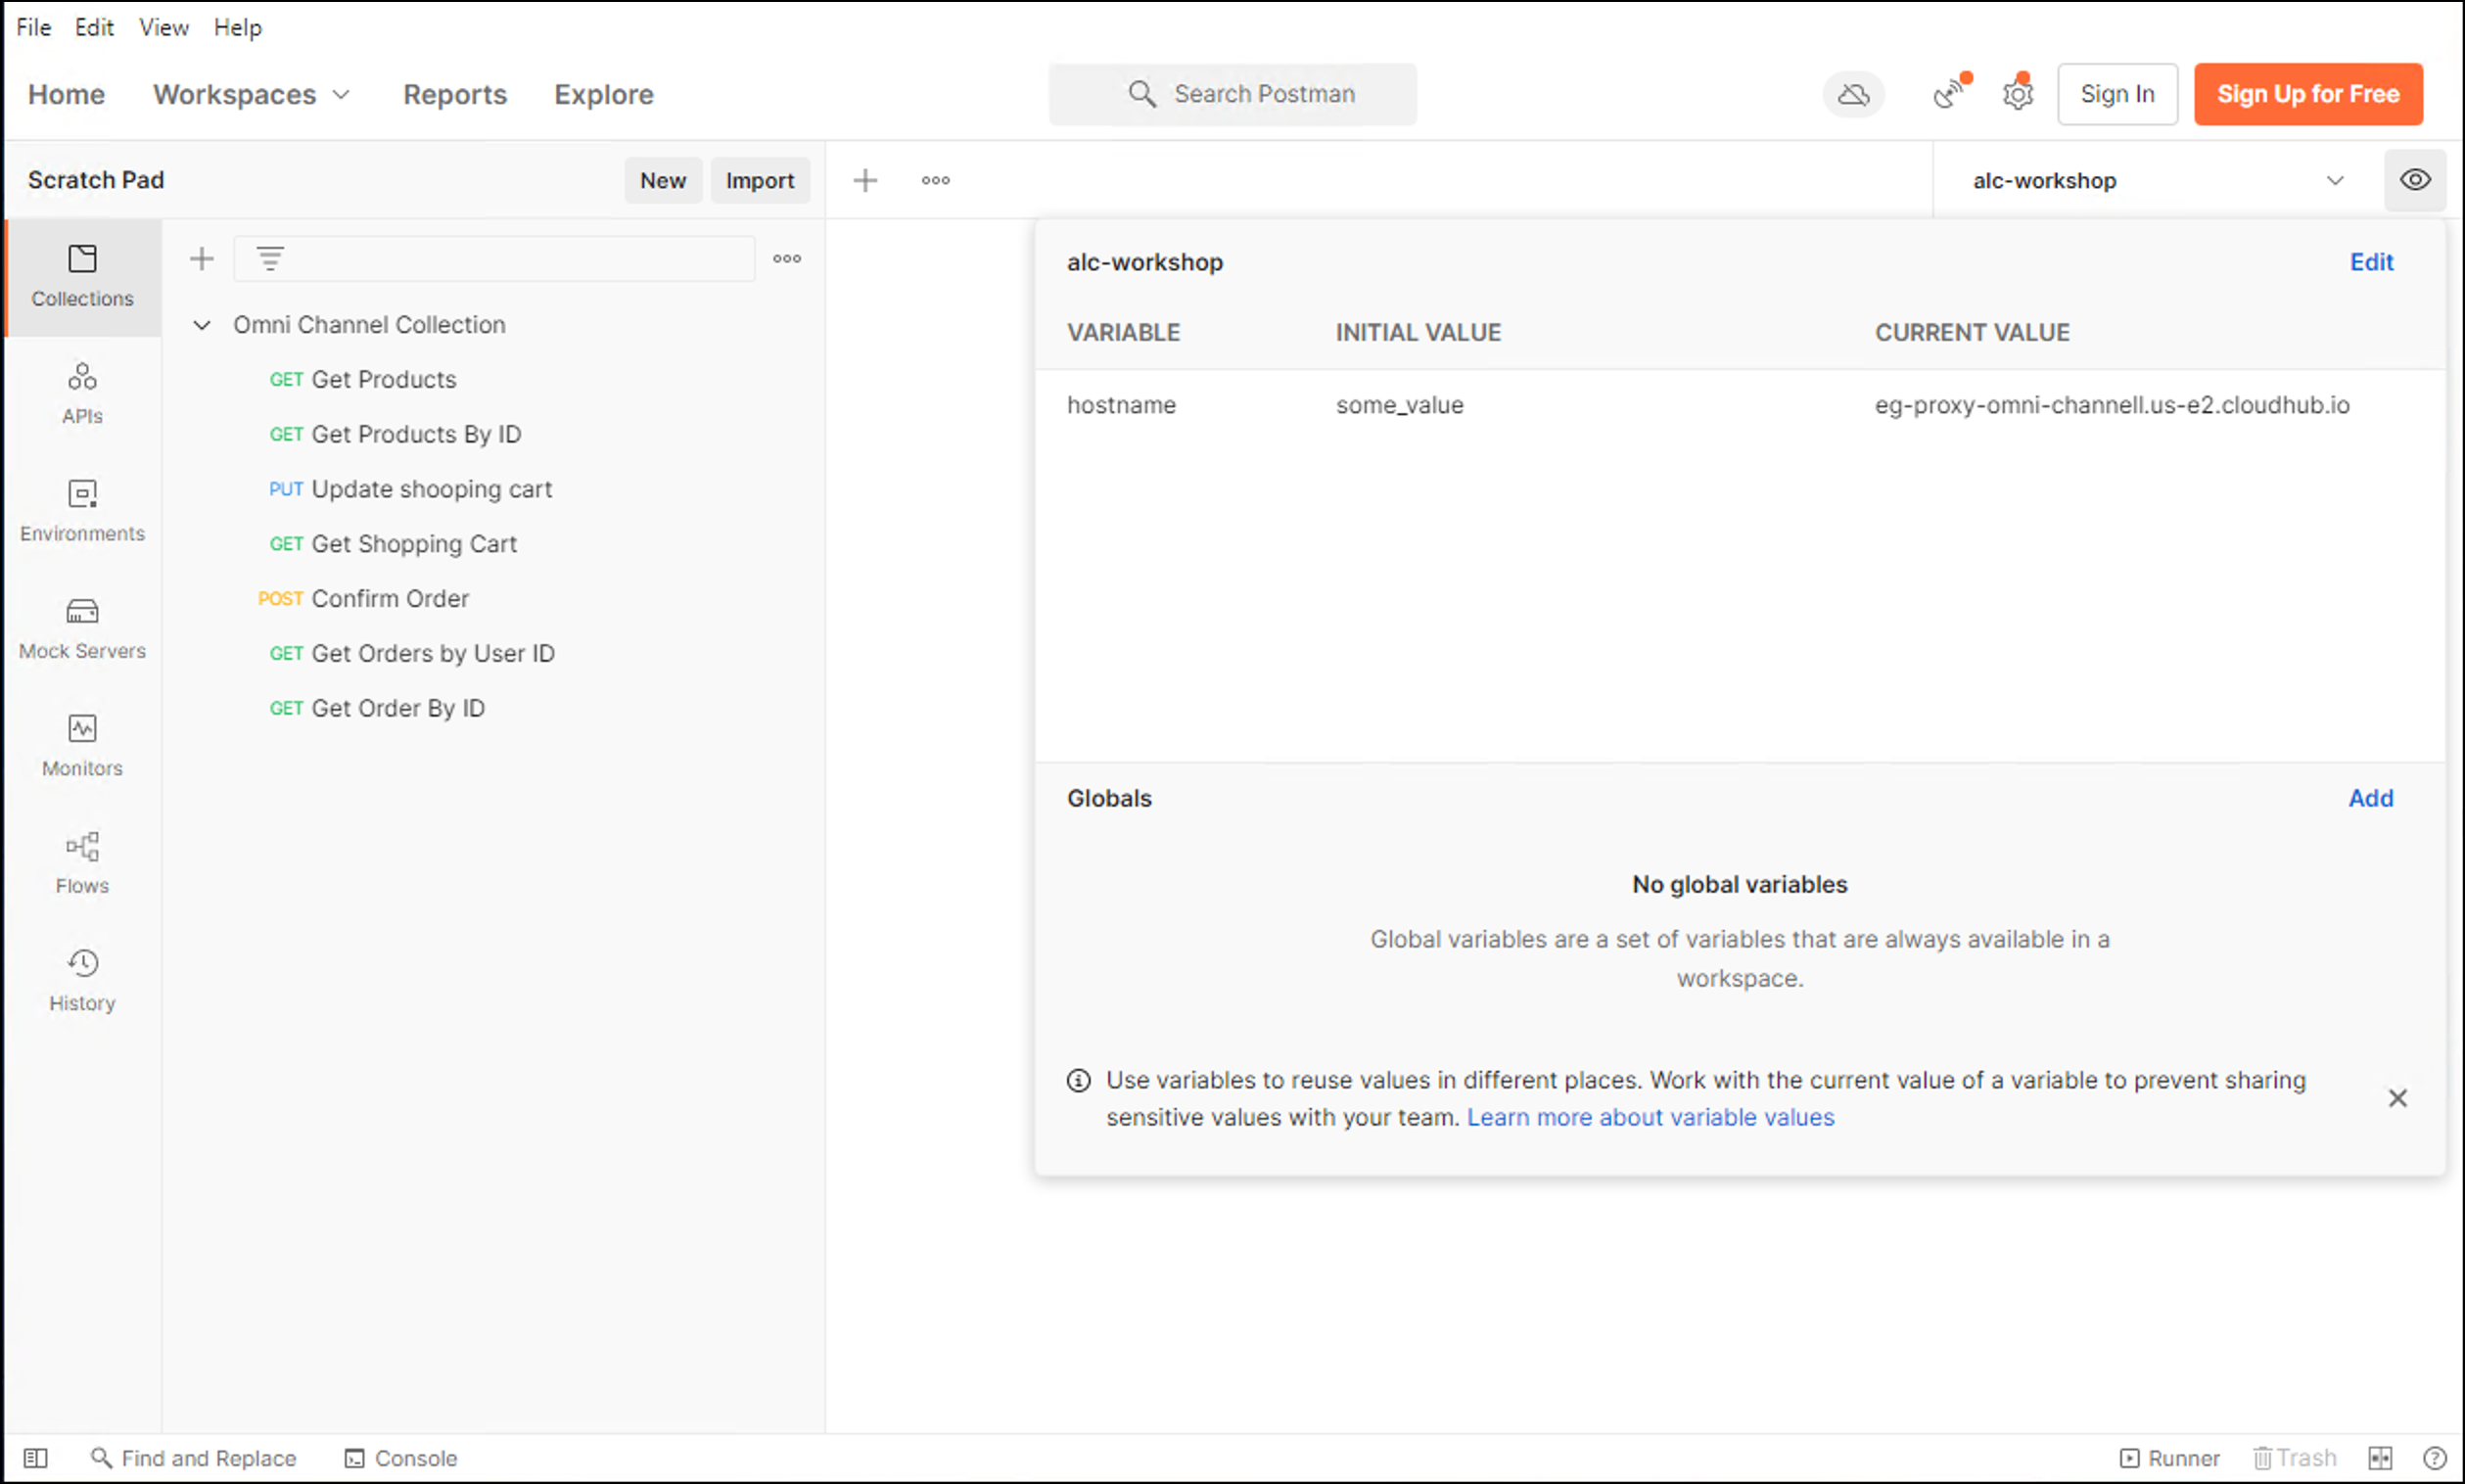
You can test one of the requests to check that the hostname value is correct.
-
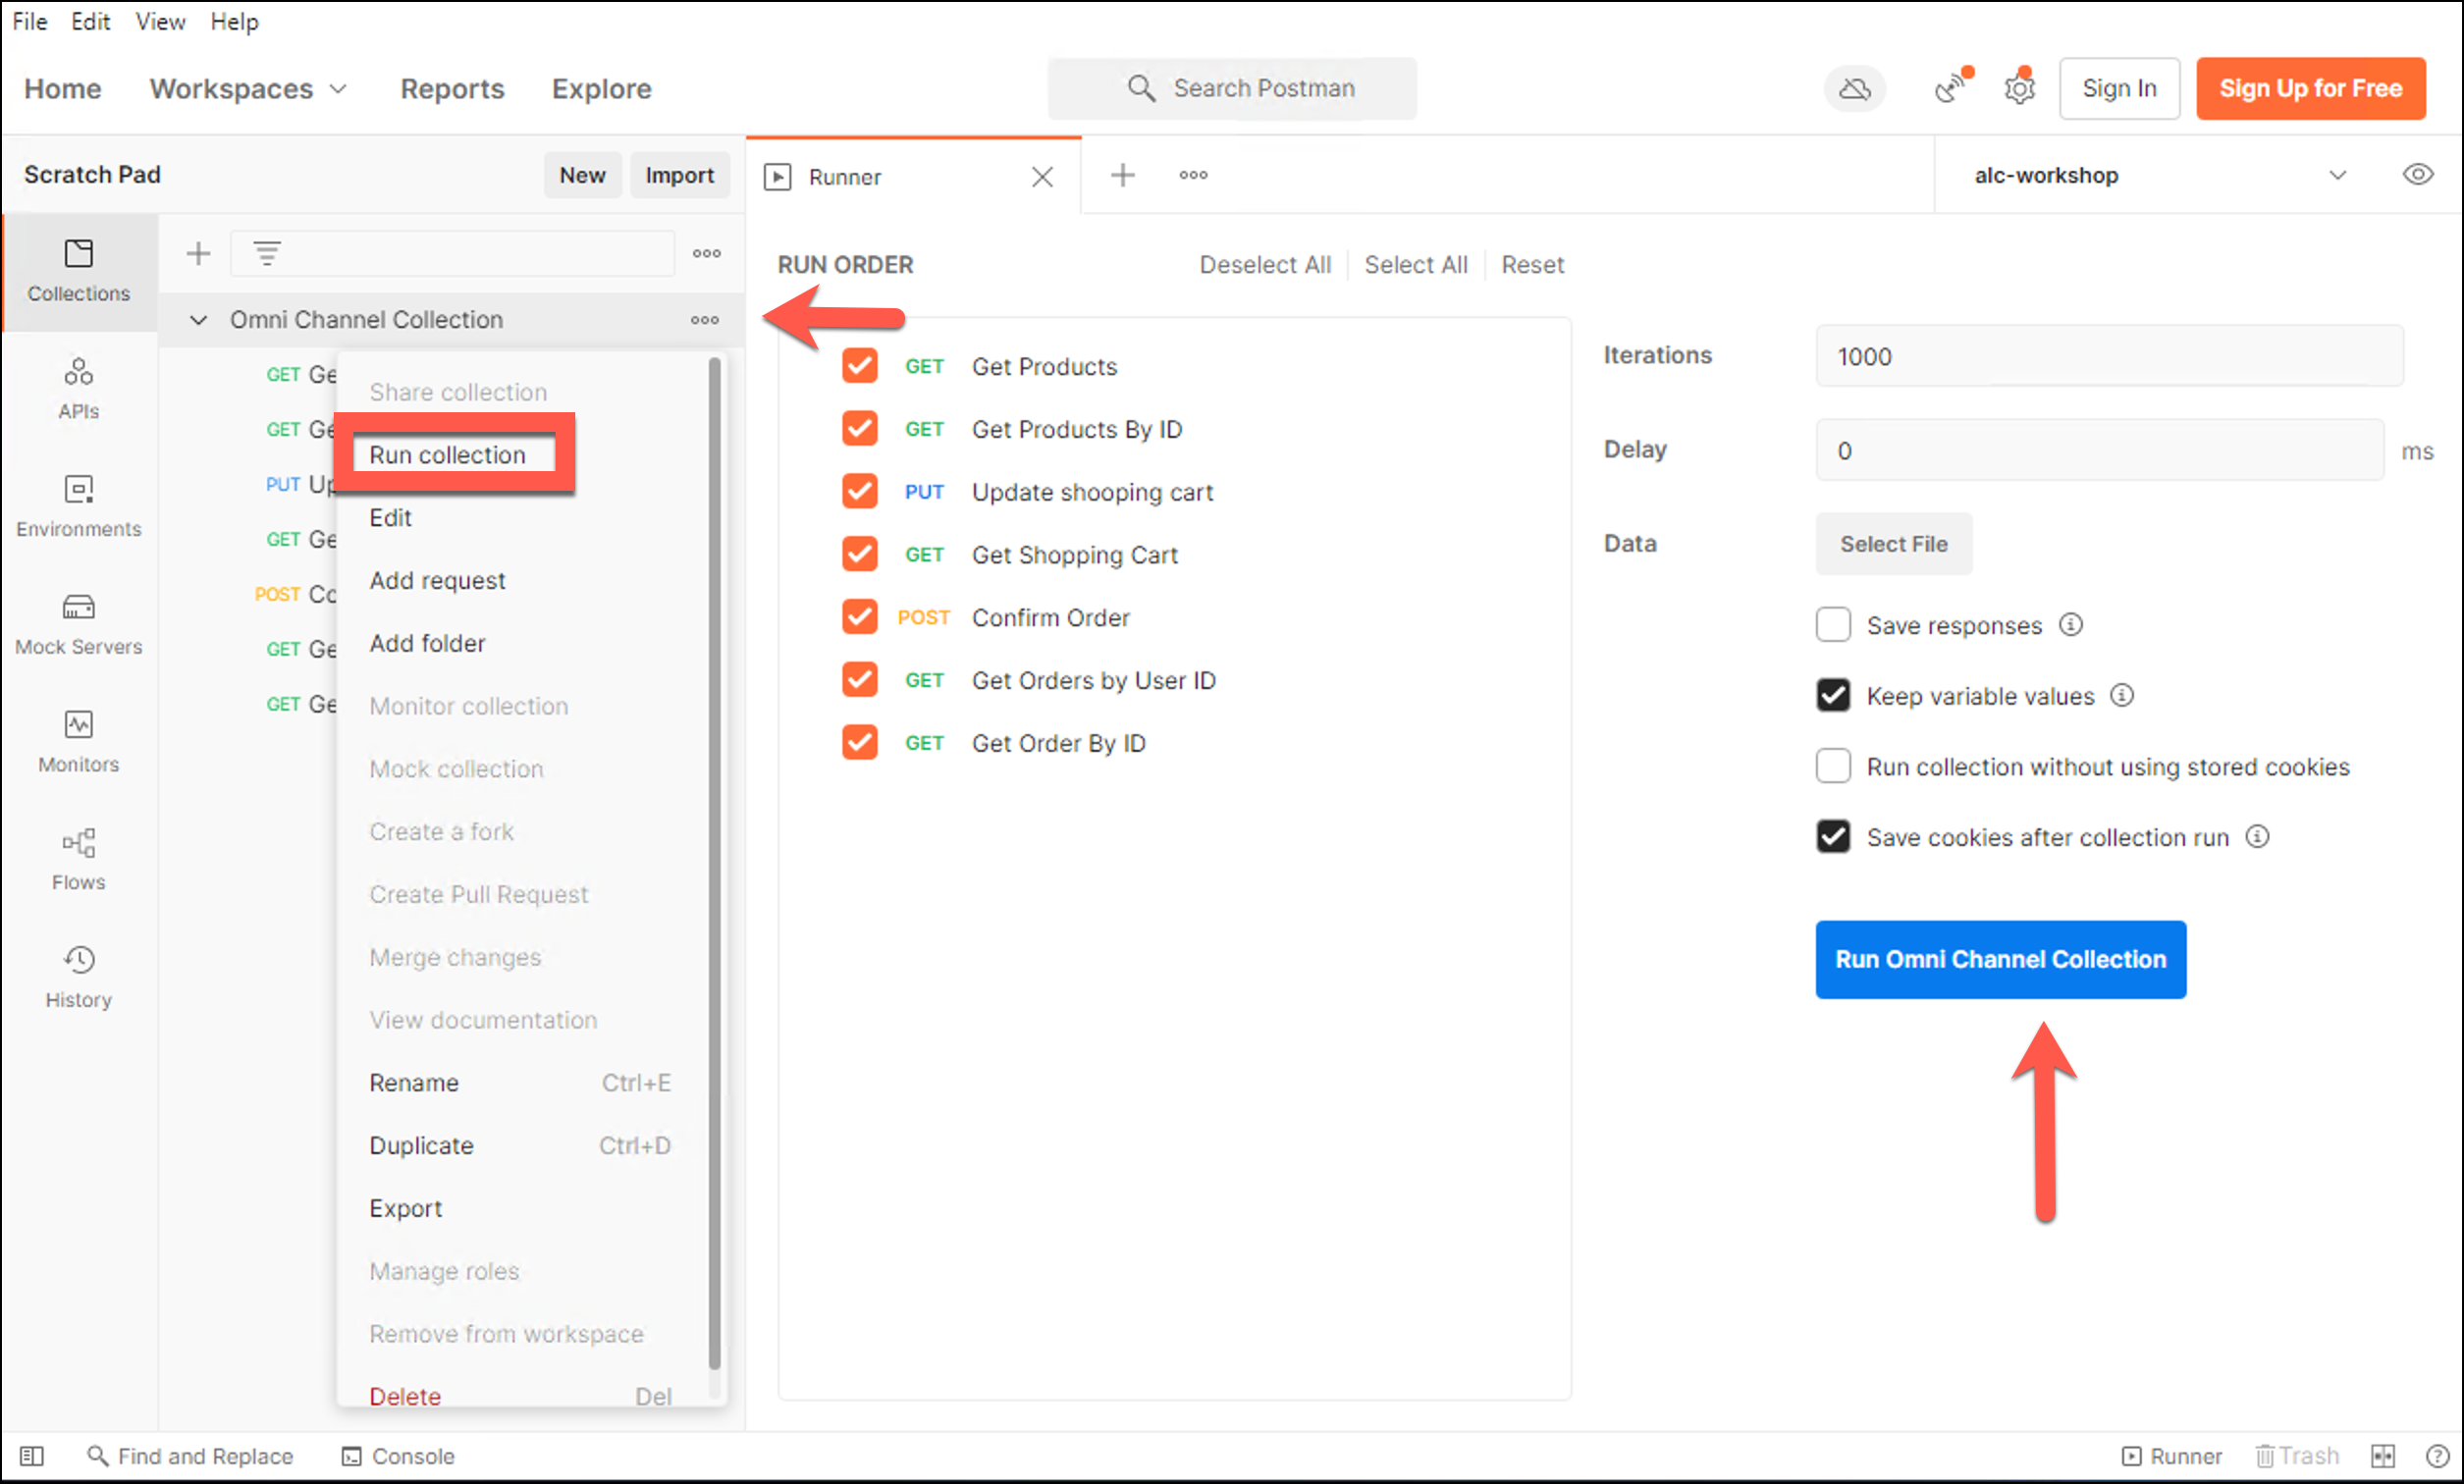
In the Collection Name, press three dots to view more actions menu and select the Run Collection.
-
Complete with the following options in the Runner options.
Name Value Environment
alc-workshopIterations
1000Delay
0 -
Leave the rest of the values as default. Press the Run Omni Channel button.
-
Wait 1 minute and go back to the Visualizer graph. Check how the different metrics changes in real time.
Notice how the API recently deployed is displayed in the Visualizer graph along with its dependencies.
Also, we are doing an impact analysis. See how the three system APIs are handling the load and we don’t need to scale any of them up.
-
Finally you can export the graph as an image.

Summary
In this lab, you completed the following steps:
-
Introduced to Anypoint Visualizer
-
Deployed a new API and verified Visualizer topology updates
-
Invoked the new API and verified Visualizer performance metric updates
Go Further:
-
See the Visualizer documentation for more information.
Congratulations! You have completed Lab 1.
Please proceed to Lab 2