Lab 3: Functional Monitoring
Overview
The API Functional Monitoring solution enables developers and operators to perform consistent and constant testing of the functional behavior and performance of their APIs, throughout the entire API lifecycle, in both non-production and production environments.
API Functional Monitoring drives up the quality and reliability of publicly exposed APIs as they are being developed, tested and delivered into production. The monitor is not only specific to APIs that you might develop on Anypoint Platform, it can also be used to perform quality and reliability tests on any publicly exposed API.
In this Lab, we are going to create an API Functional Monitoring test that will call APIs on a regular interval and perform tests to ensure reliability and quality of a publicly exposed API.
Step 1: Test Endpoint
-
In the previous lab we deployed the omni-channle api to runtime manager. Now we need to go back to it and copy the public endpoint.
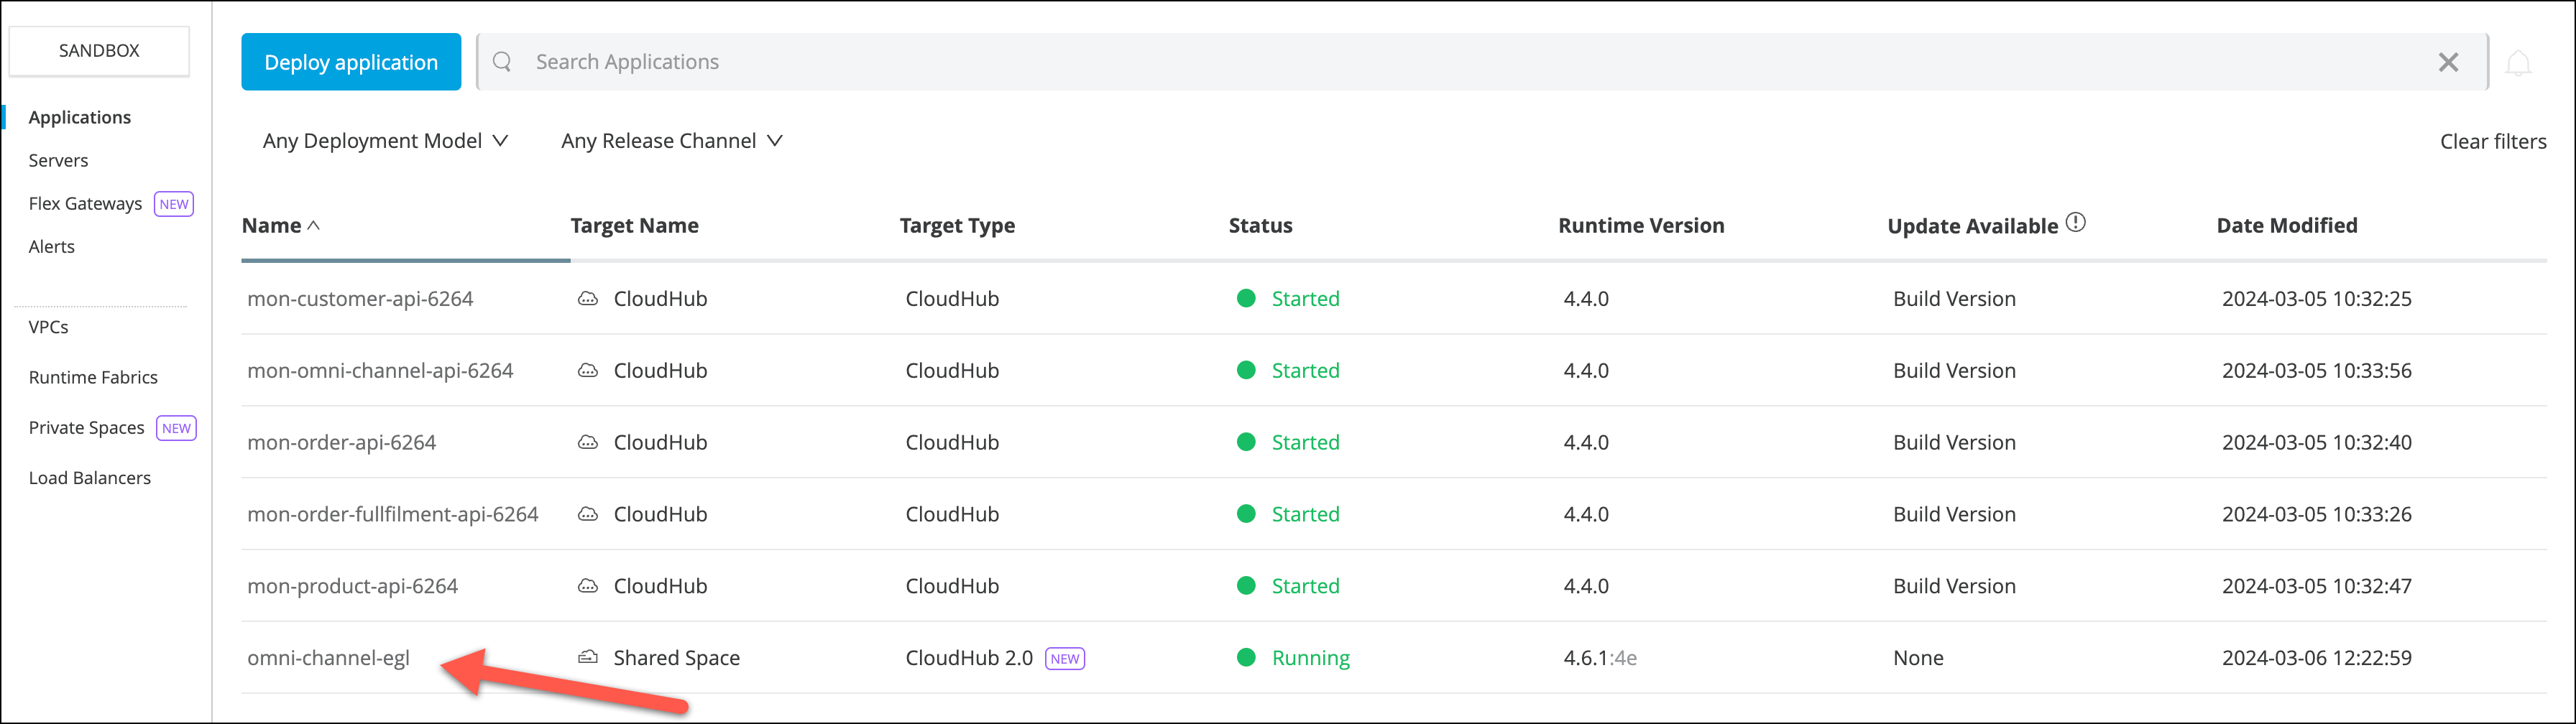
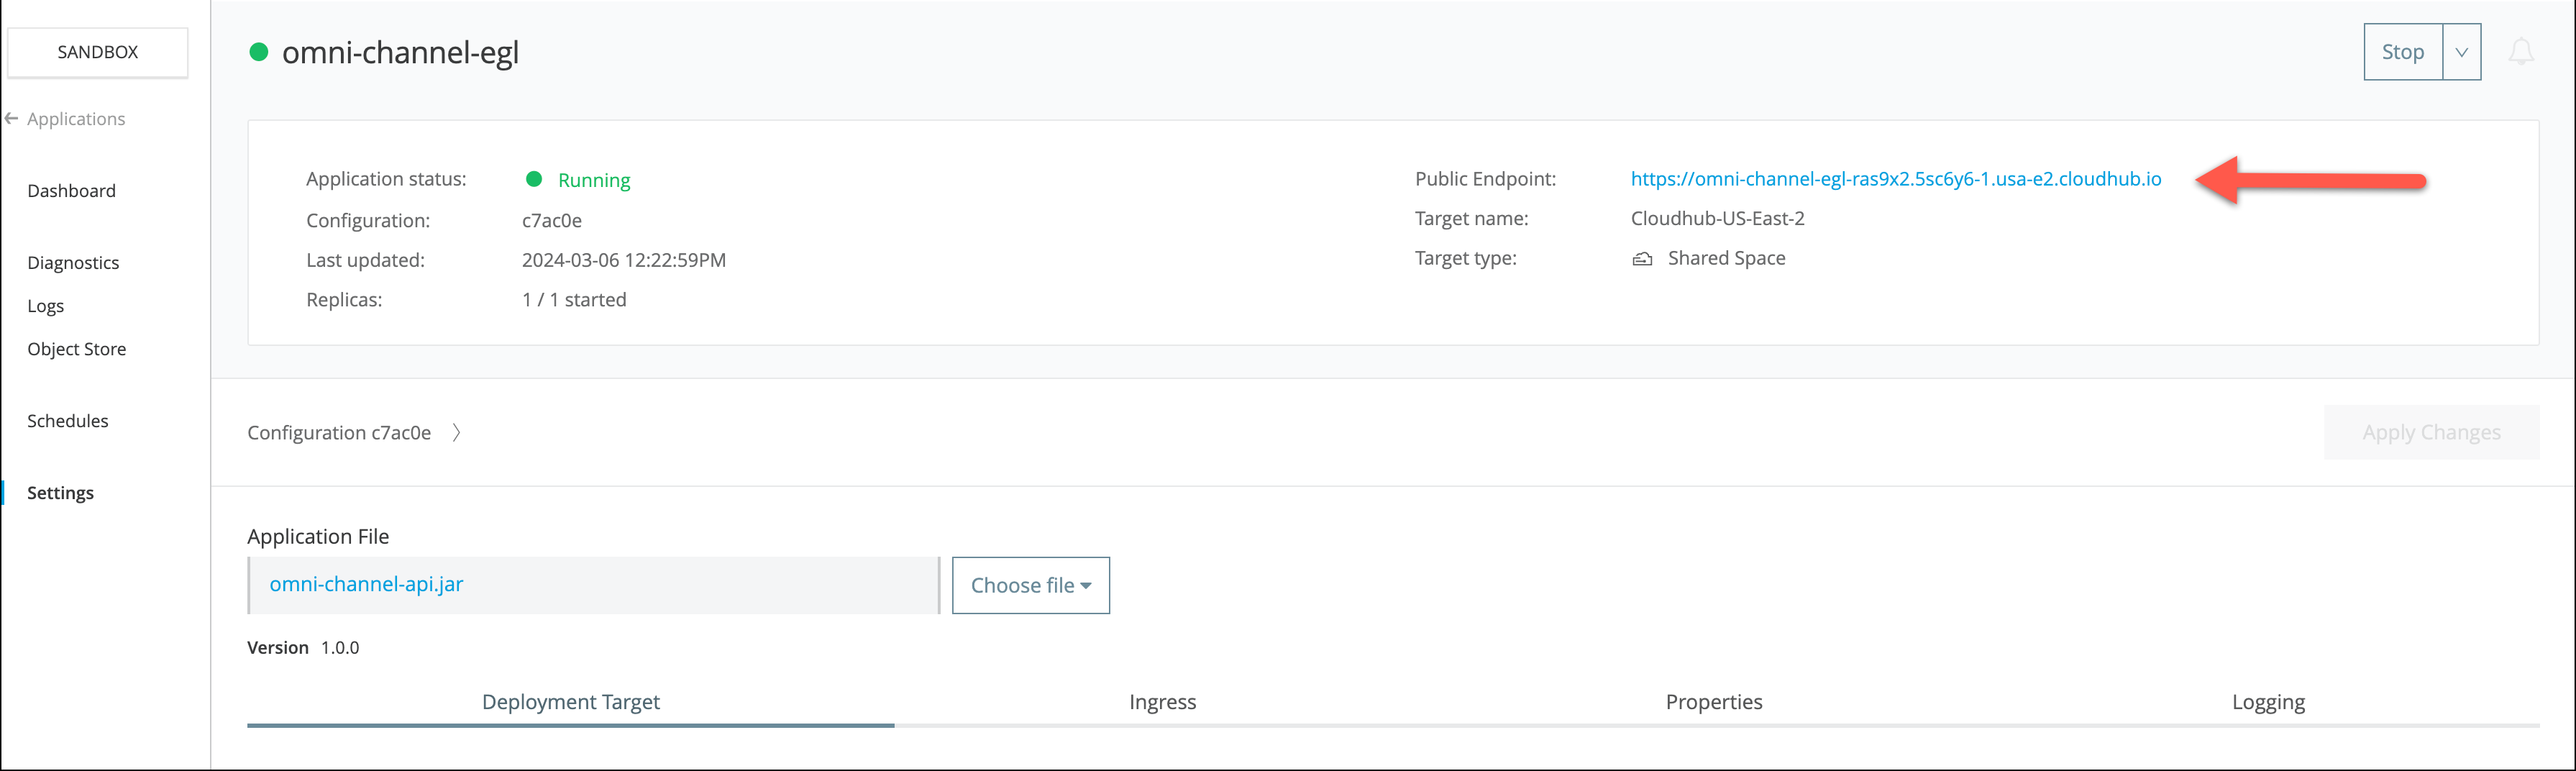
-
We want to select an endpoint to use in our functional monitor. To keep this simple let’s use the
GETProduct by id endpoint. -
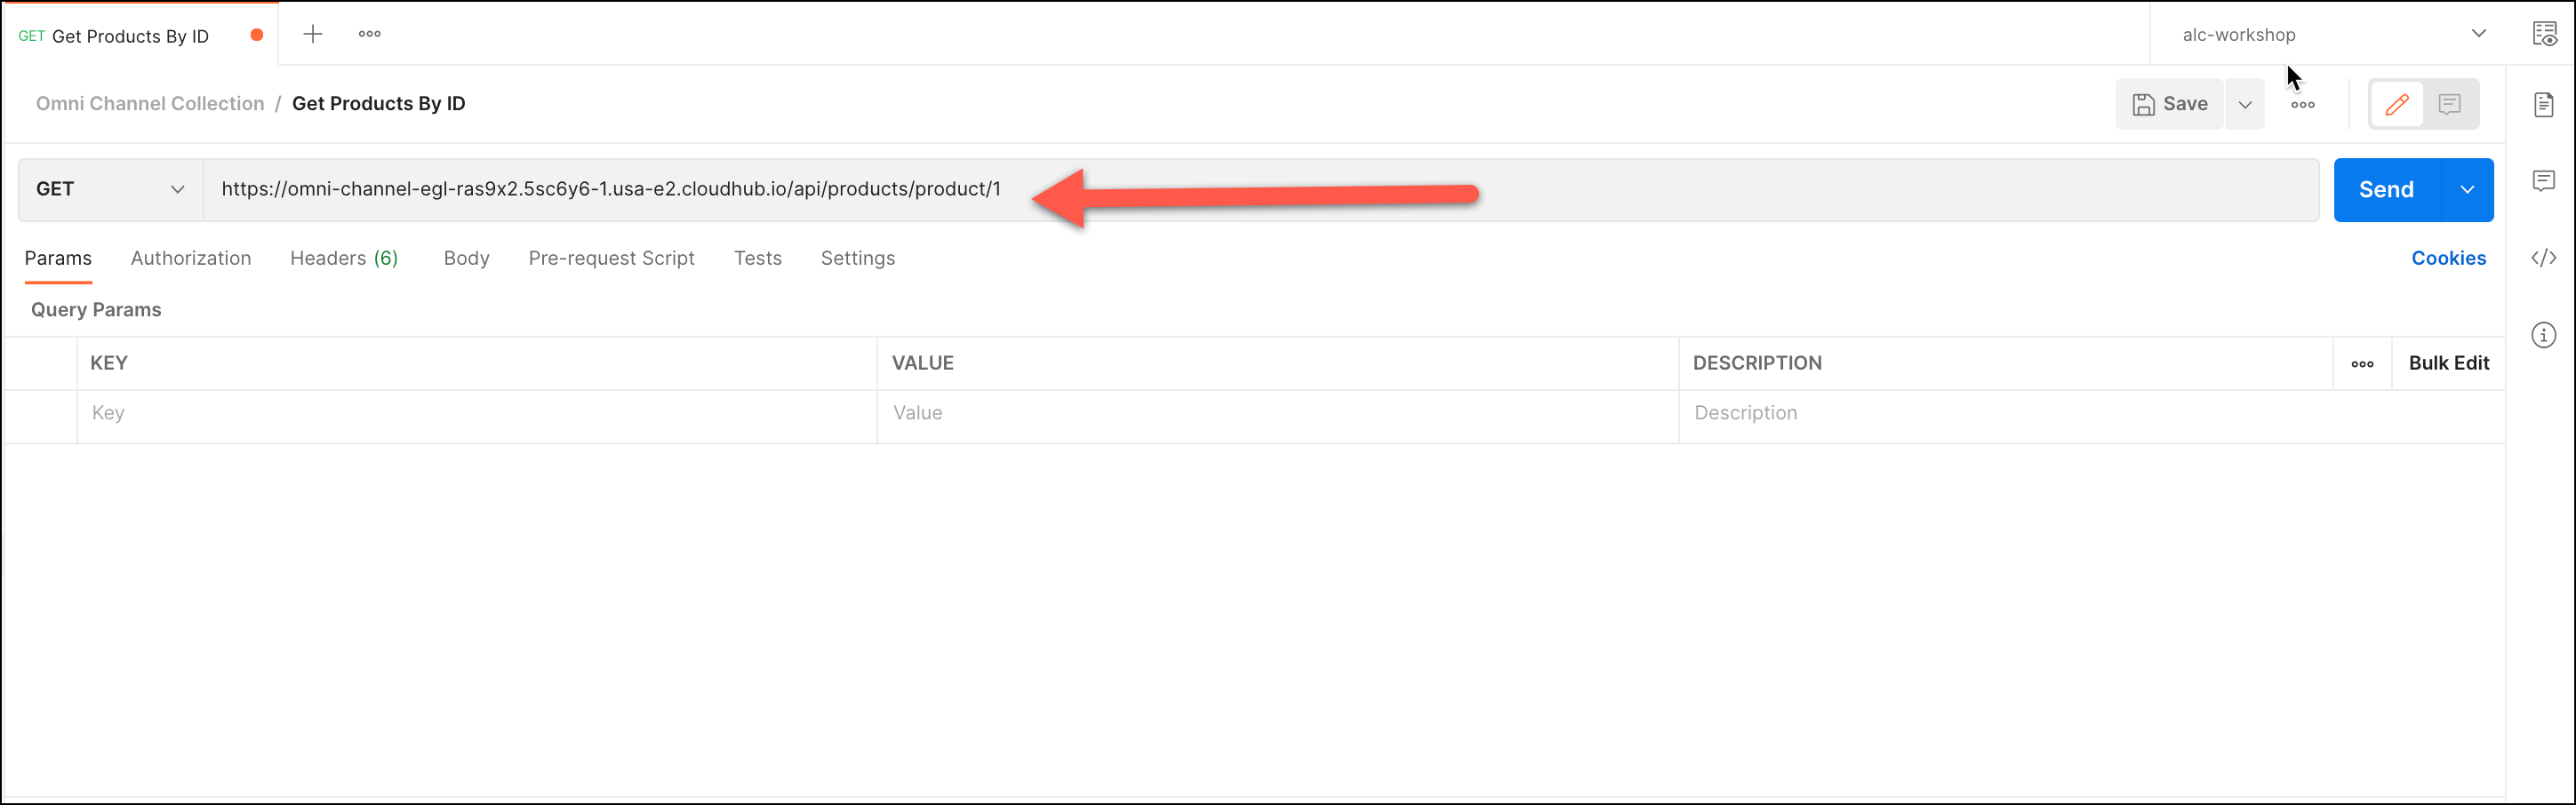
Go to the Postman app and add a GET call
-
Paste the url from the omni-channel API and write the rest of the url to get the product with id 1
-
The url should look like this 'https://[your url]/api/products/product/1'
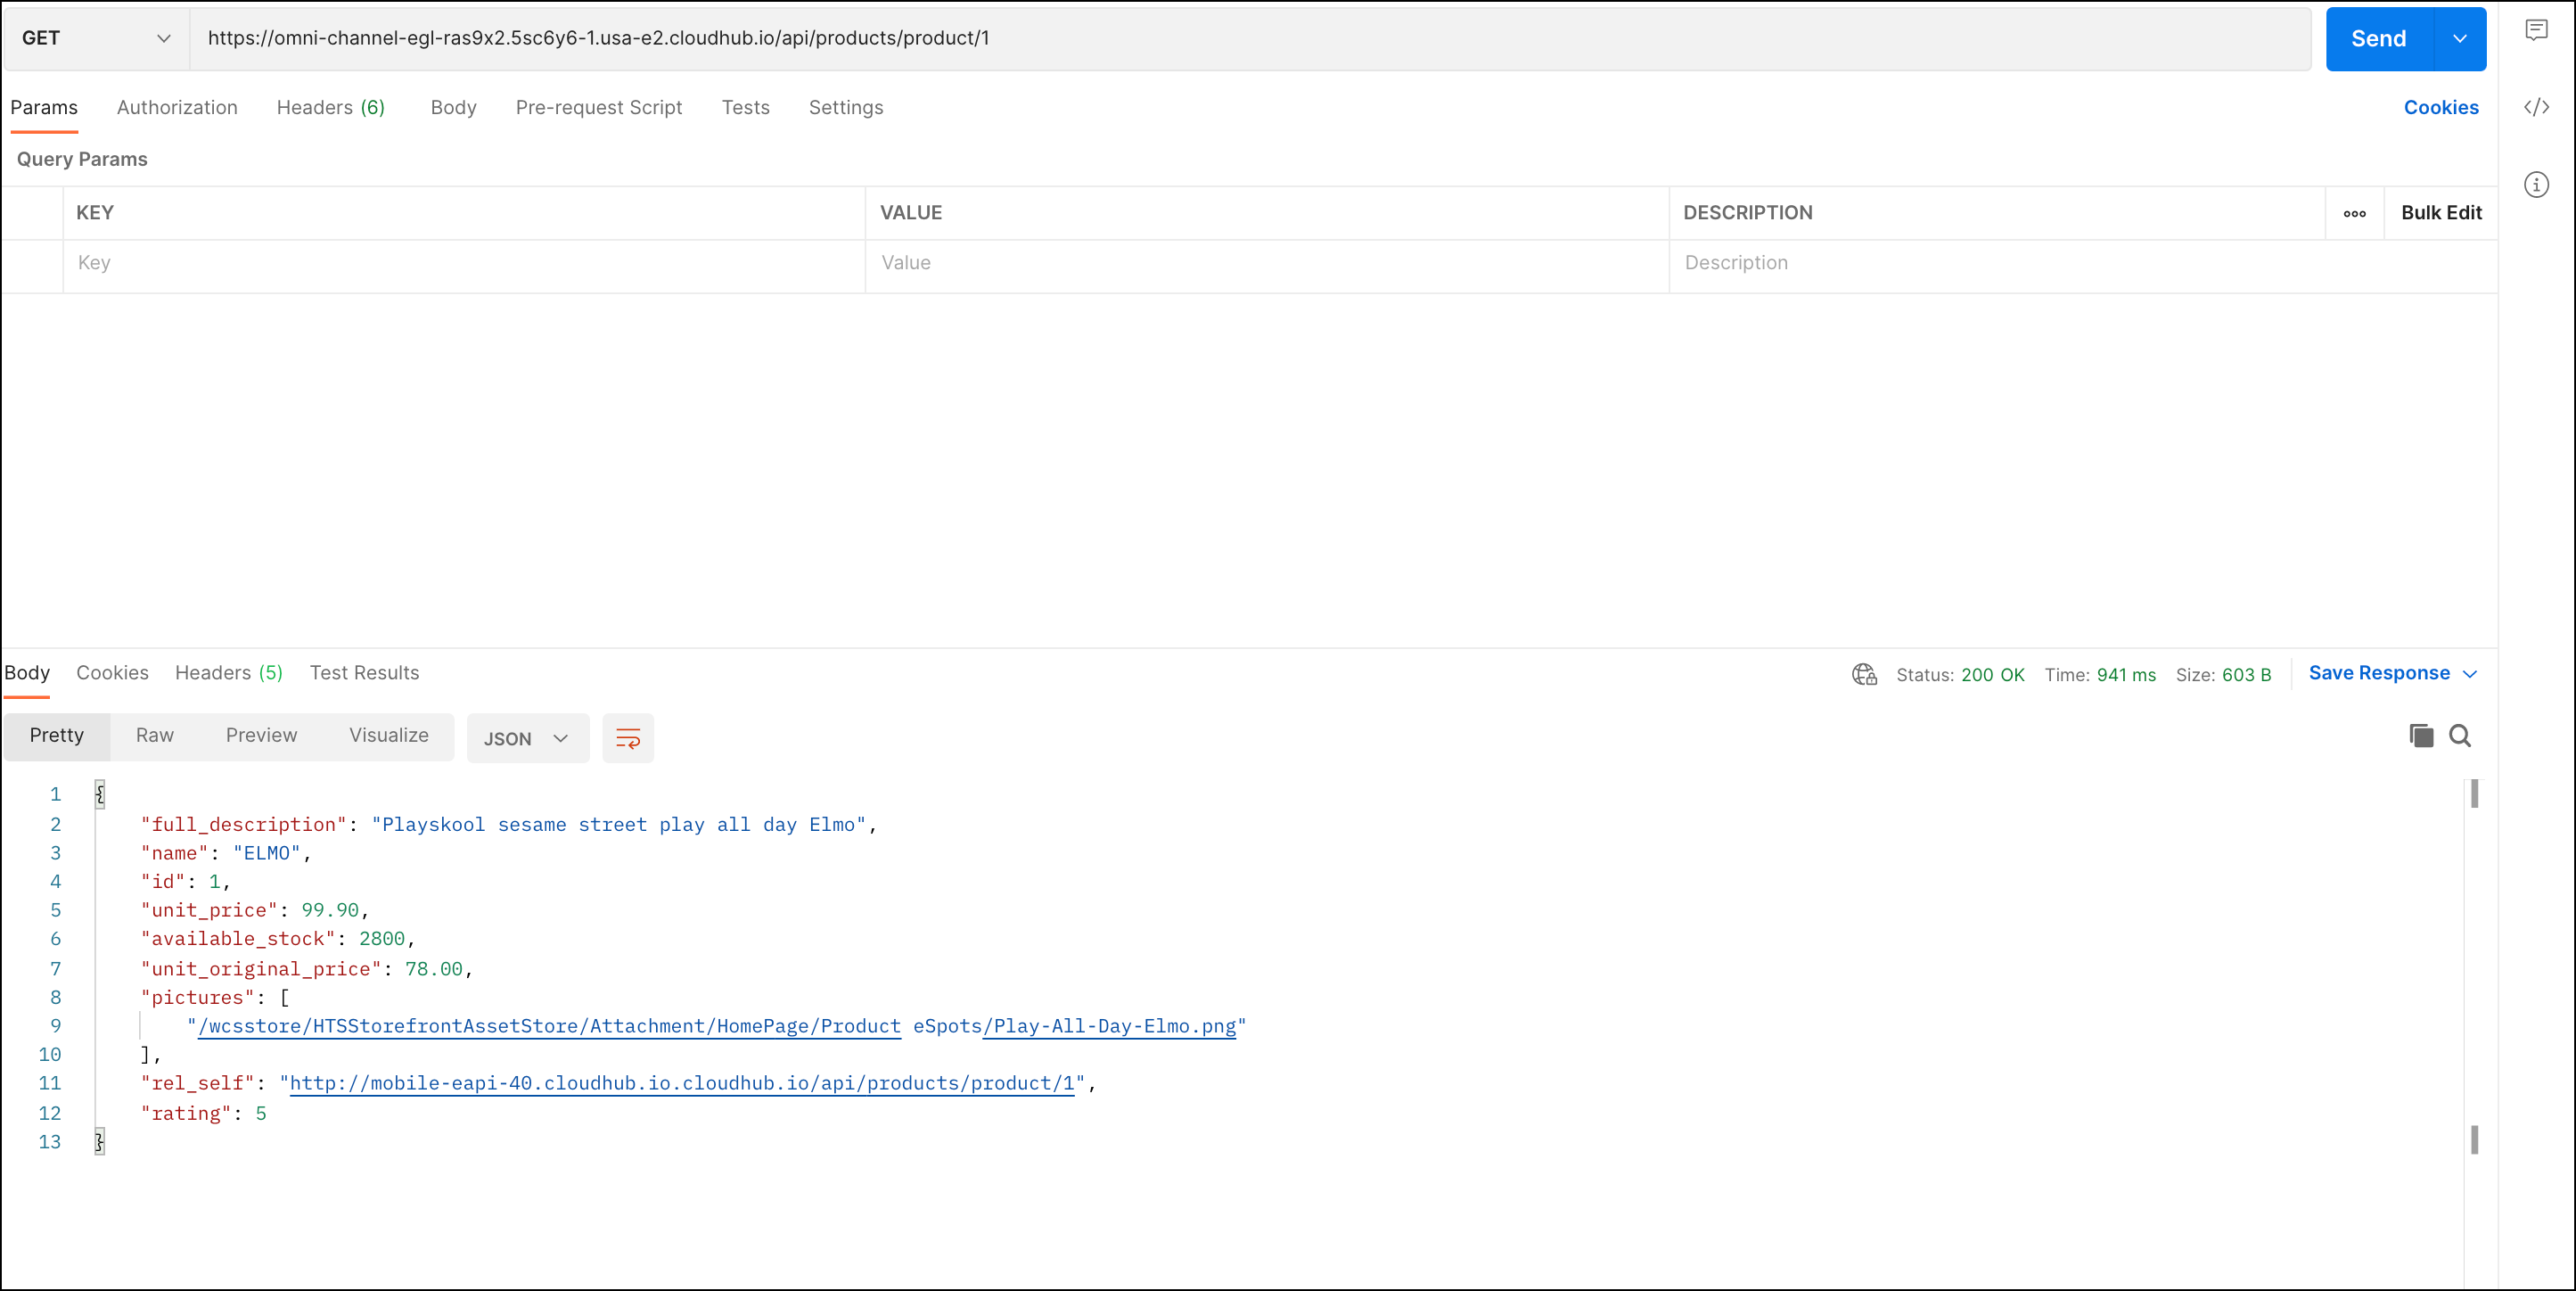
Click
Sendin the top right corner to test out the APIYou should see the output for a product, possibly an ELMO toy.
-
Now that you are sure the endpoint is working you should copy the url from the request url field and make a note of this for use in the functional monitor.
Step 2: Create a Functional Monitor
-
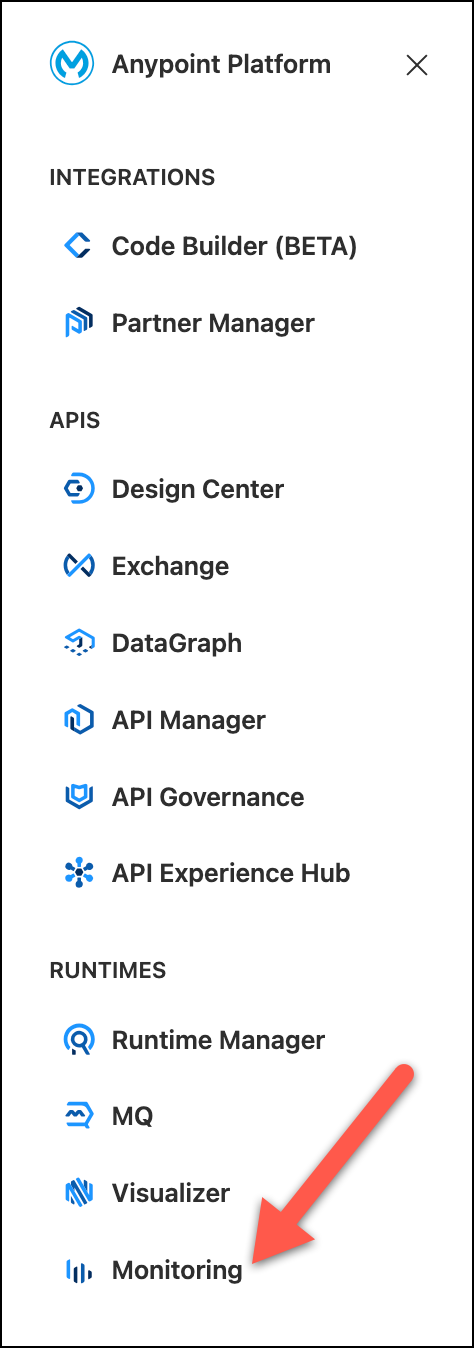
Return to Anypoint Platform and from the main menu in the top left, navigate to Monitoring and then click Functional Monitoring where you will be presented with a page that looks similar to this:
-
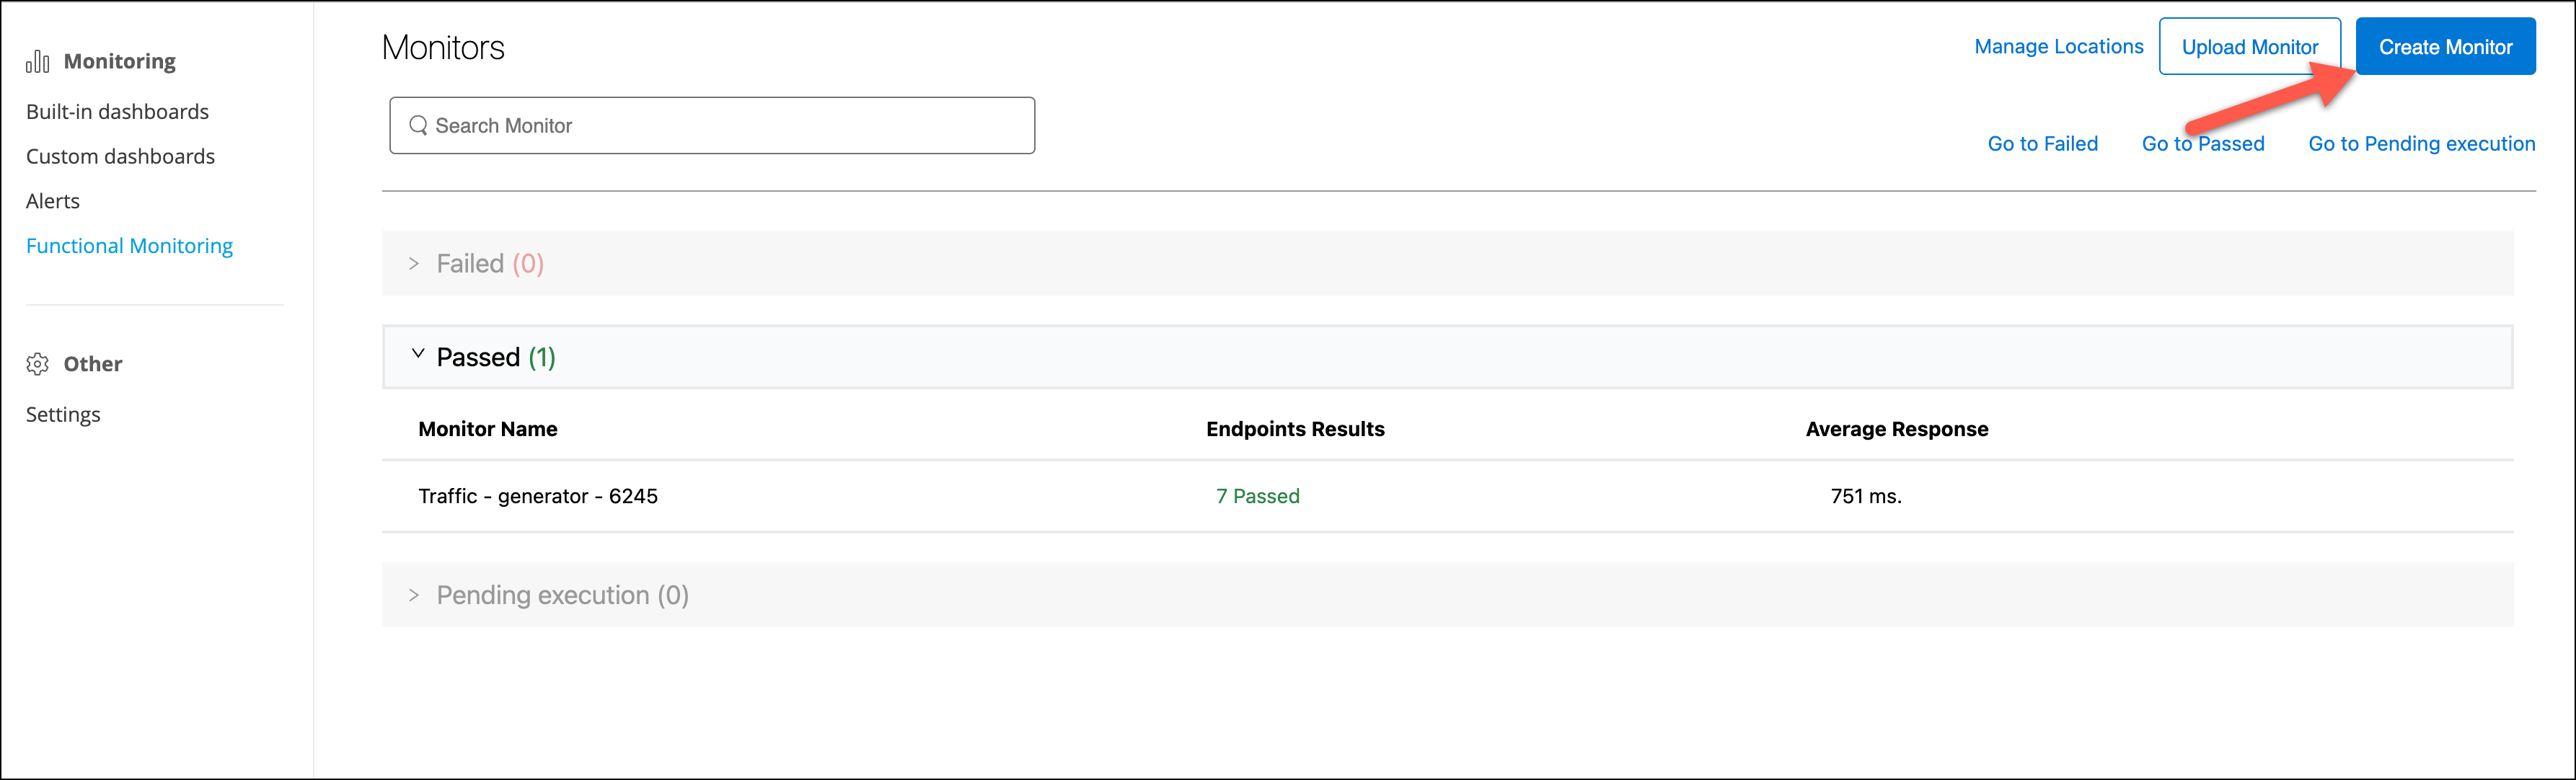
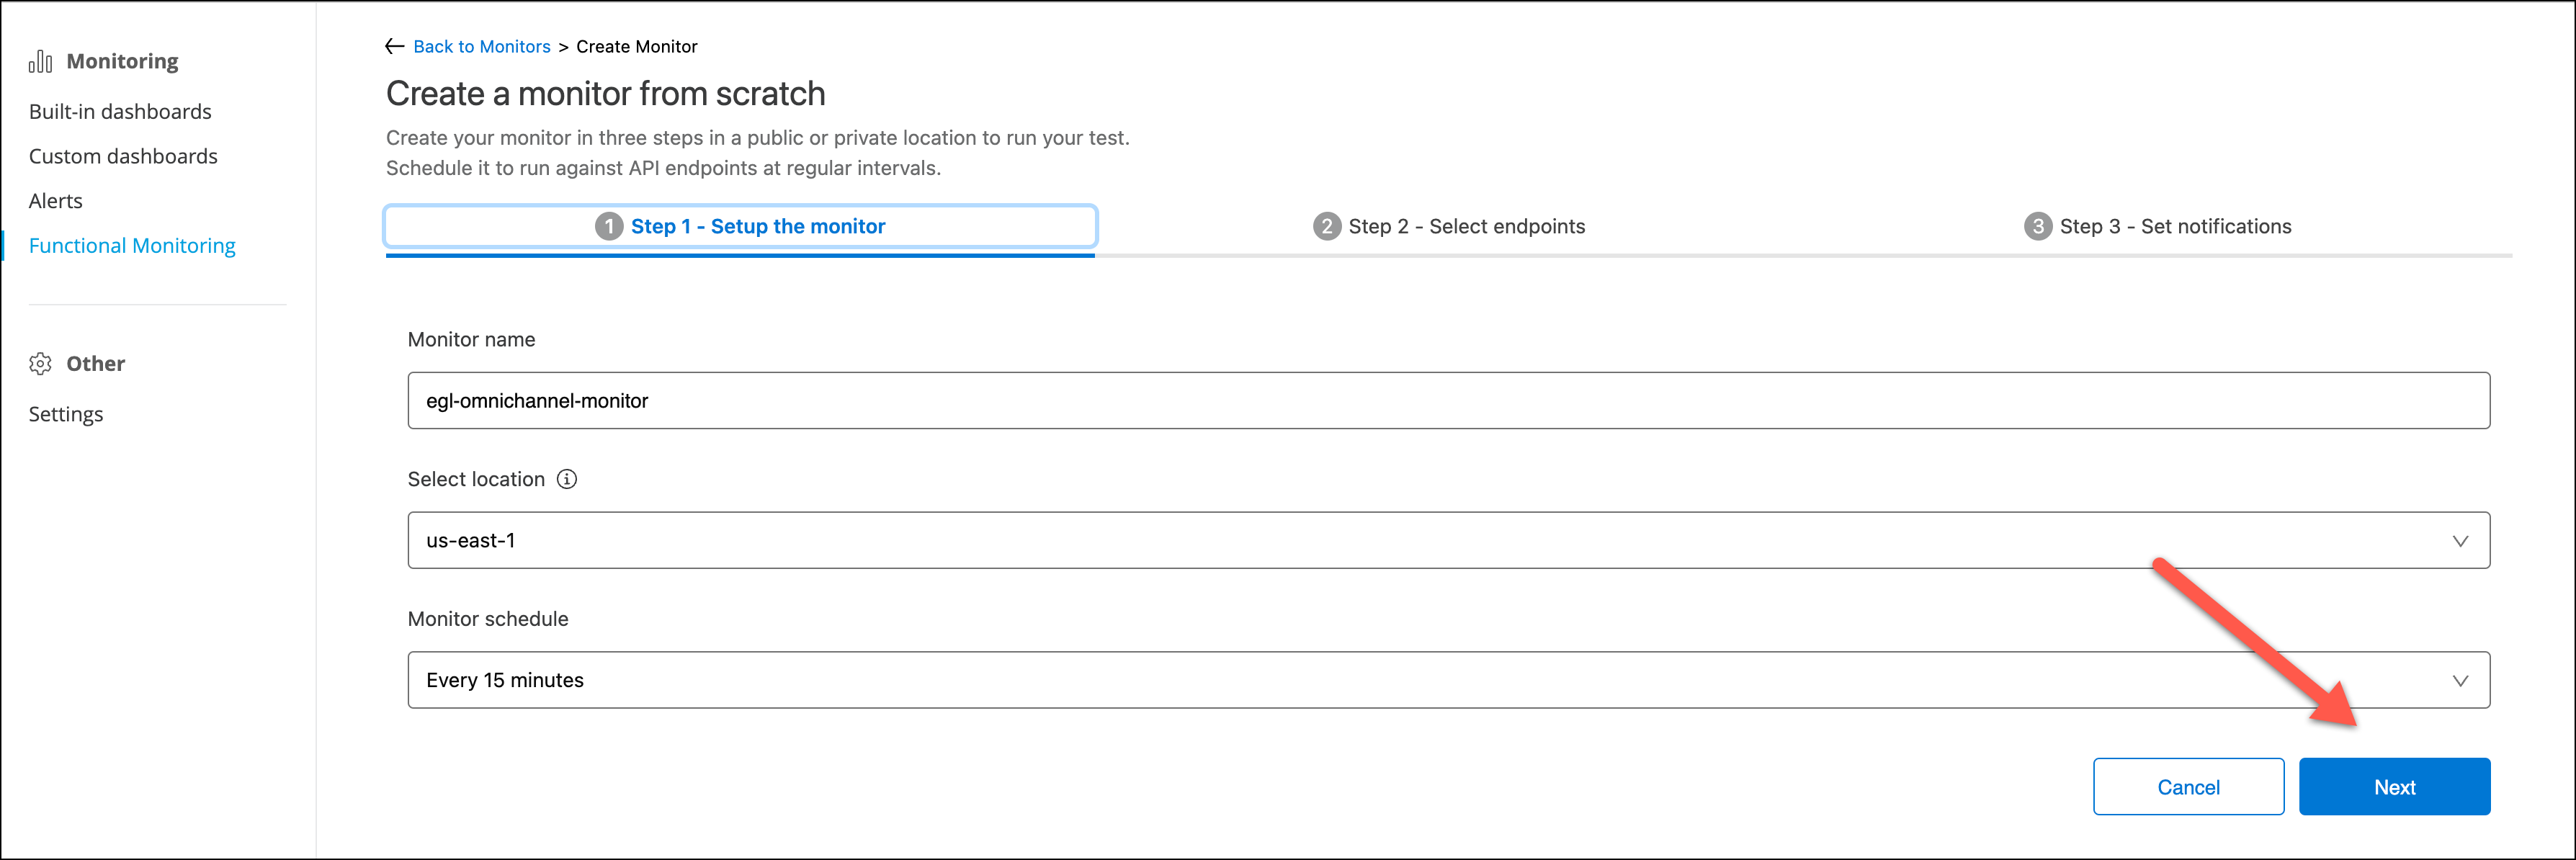
We want to create a monitor, click Create You then be presented with a set of steps. First step is to give the monitor a name. Use your initials and the following -omnichannel-monitor The name would look like this:
egl-omnichannel-monitorLeave the rest of the vales as default.
-
Click next and you are onto step 2 of the process:
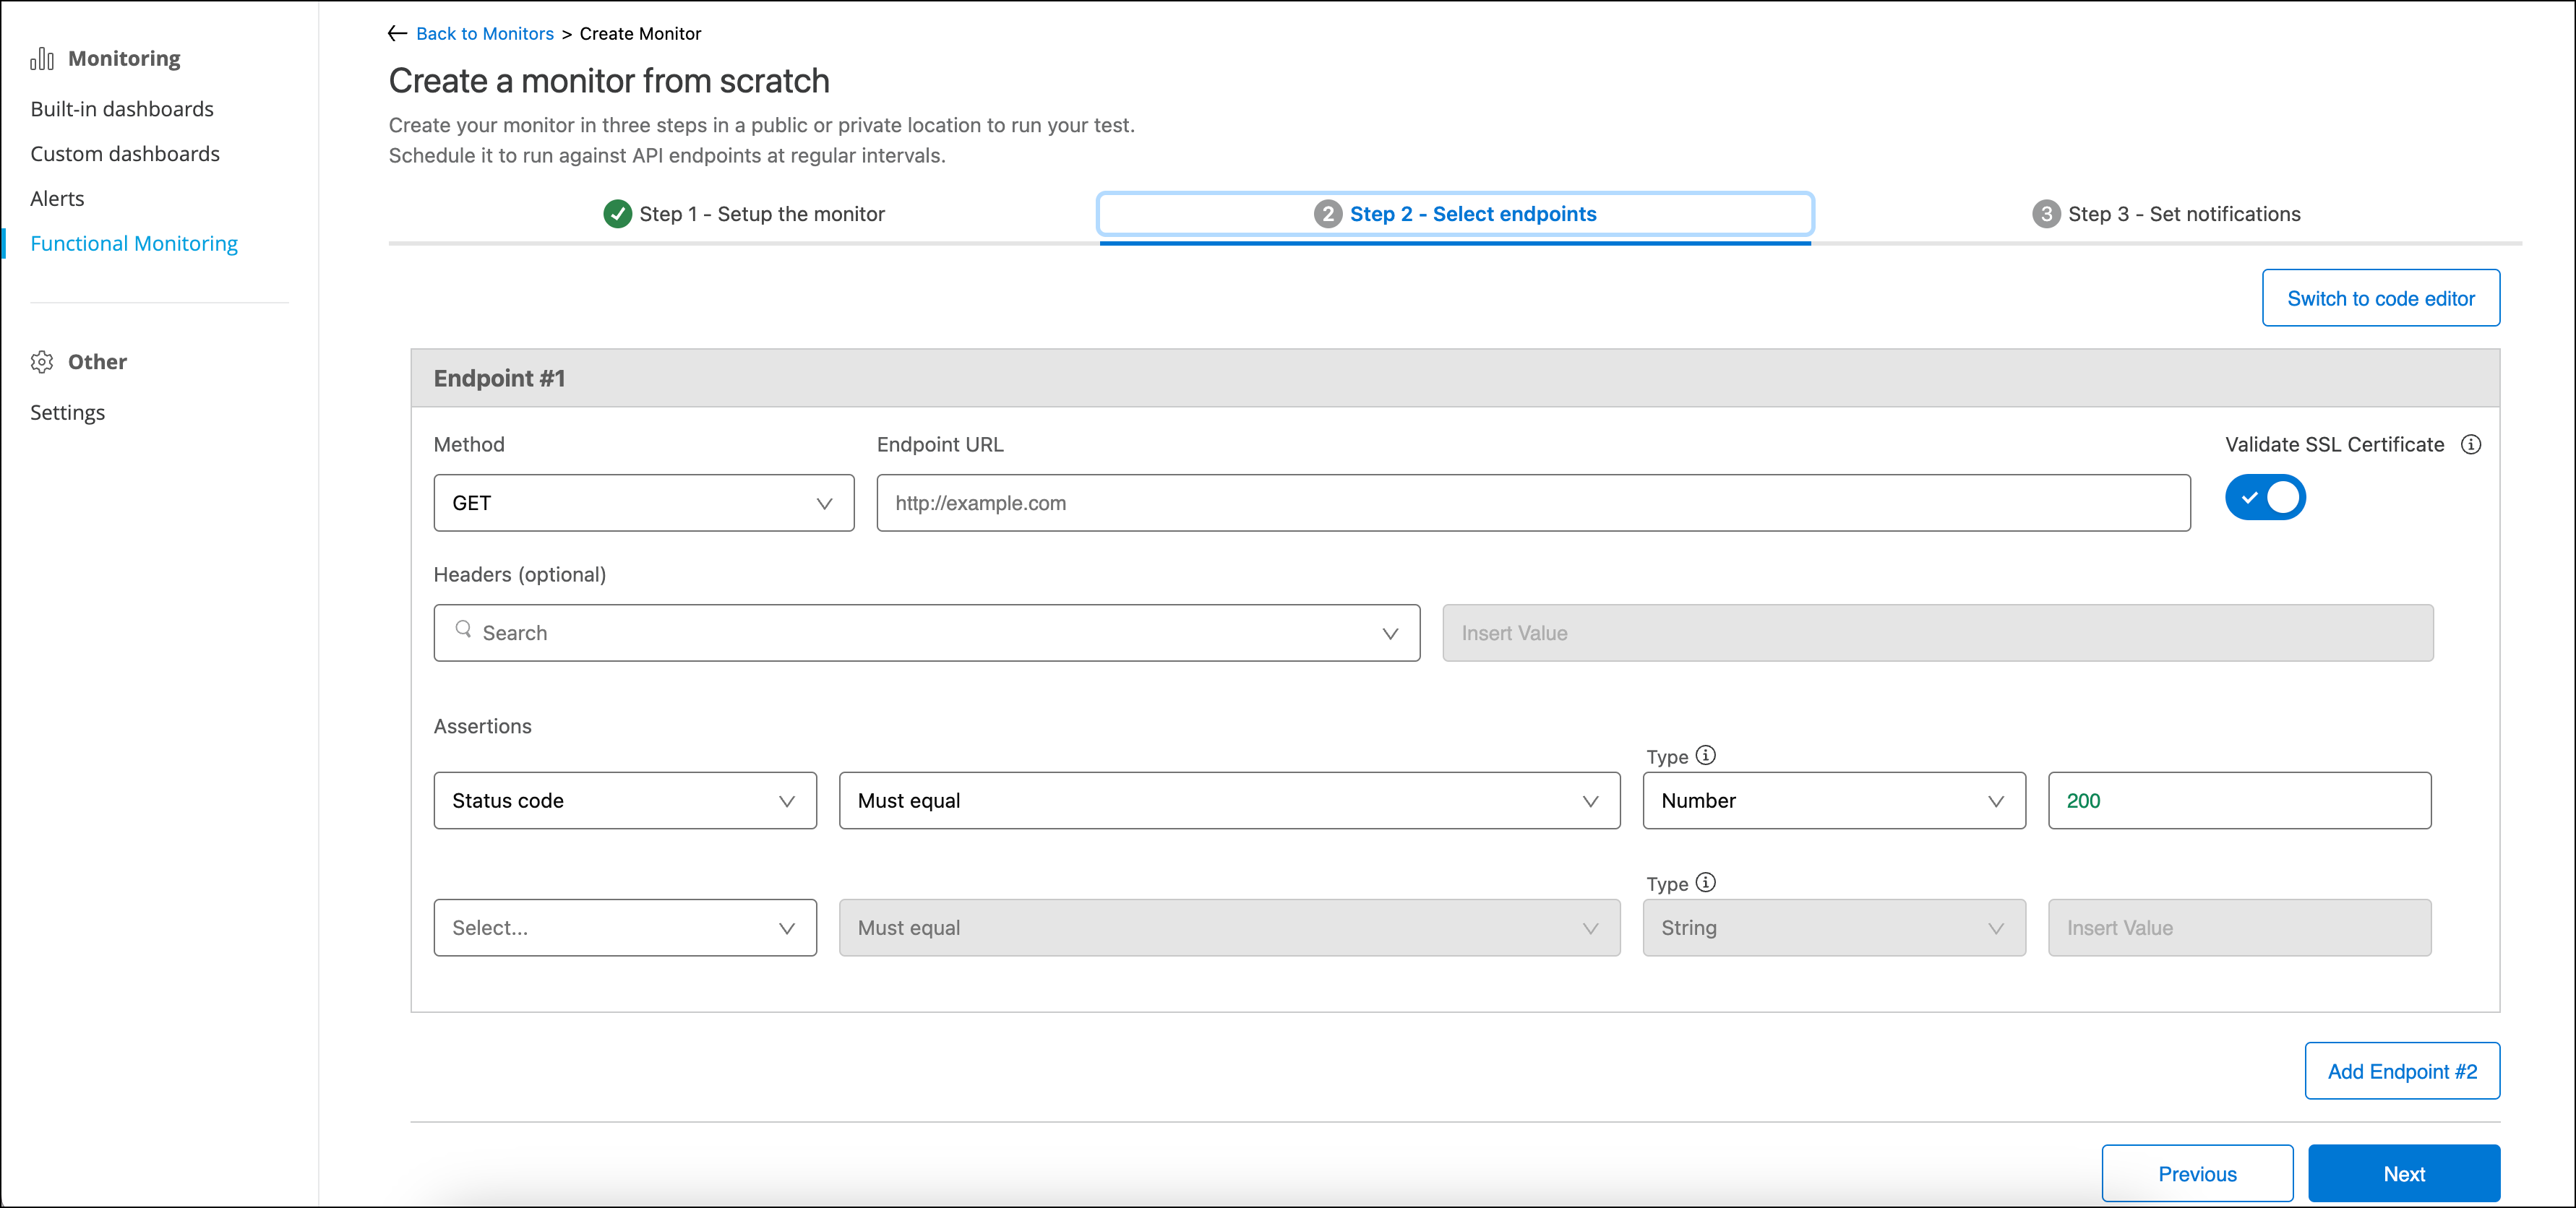
Here you are presented with a way to specify the endpoint & HTTPS method that you will use to monitoring an API. You also have the option to create the endpoint in code editor window:
-
Go back to the Postman app for the omni-channel-api and copy the request url for the query that was performed
Then return to the browser tab with the functional monitor and paste in the request url
-
Now we want to add some assertions to ensure we get the functional behaviour we are expecting from the API.
There are 2 assertions we are going to add:
-
Status code must equal 200
-
Response body id must equal 1
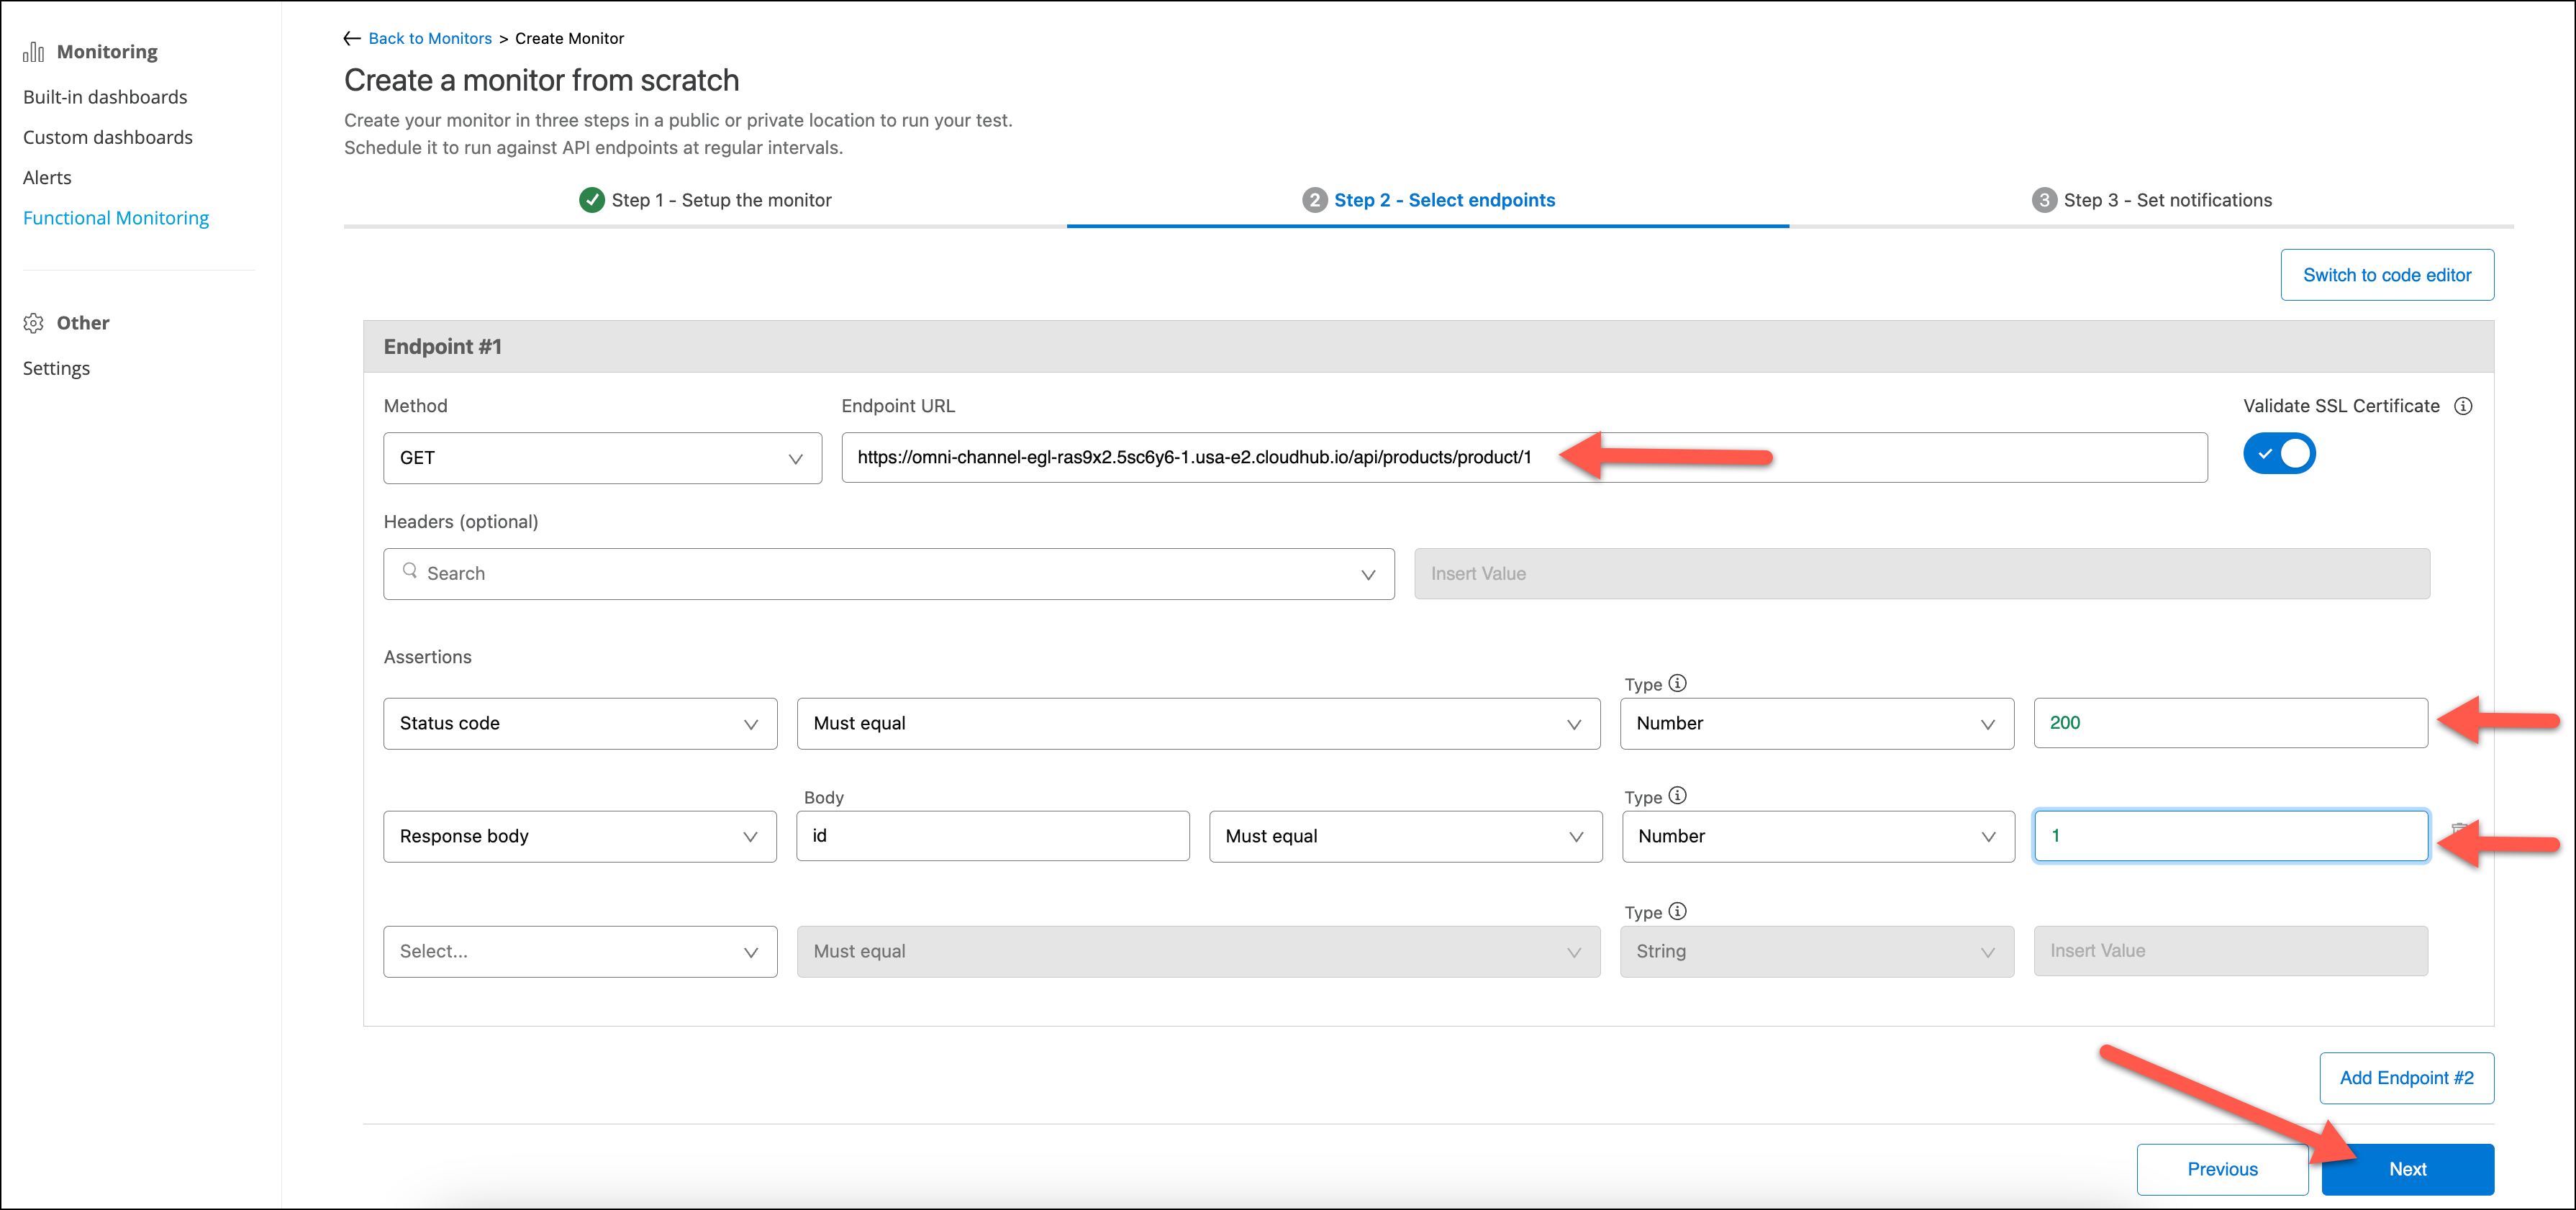
Click Next to continue
-
-
Step 3 is where we can add reporters which feed 3rd party notification tools. You will add an email reporter as part of this step.
On the first box open the drop down list and choose email
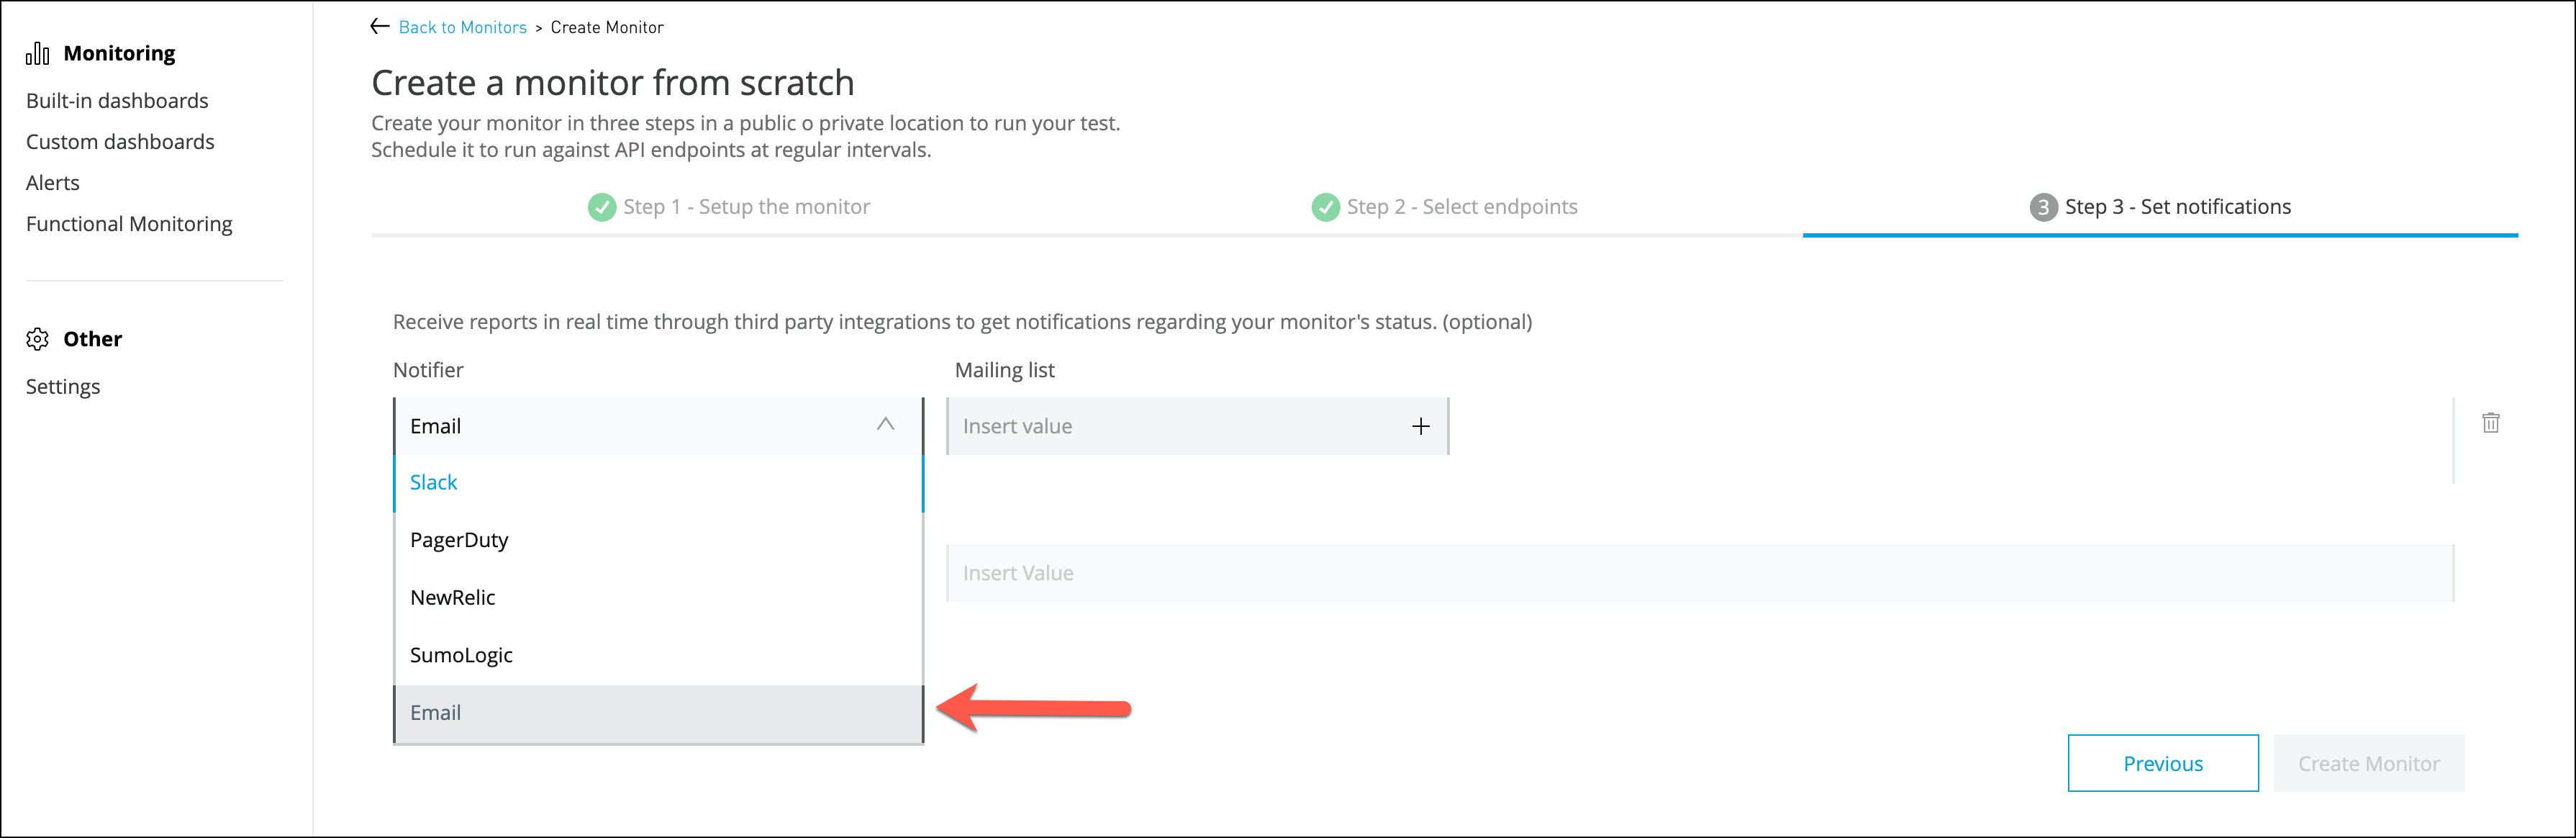
Once Email is selected move to the next box, add your email address and press enter on the keyboard. You can enter multiple email addresses as needed.
You need to press the Enter key to register the email address in the field. -
The configuration of the monitor is now complete. The final step is to click the create button the bottom of the page.
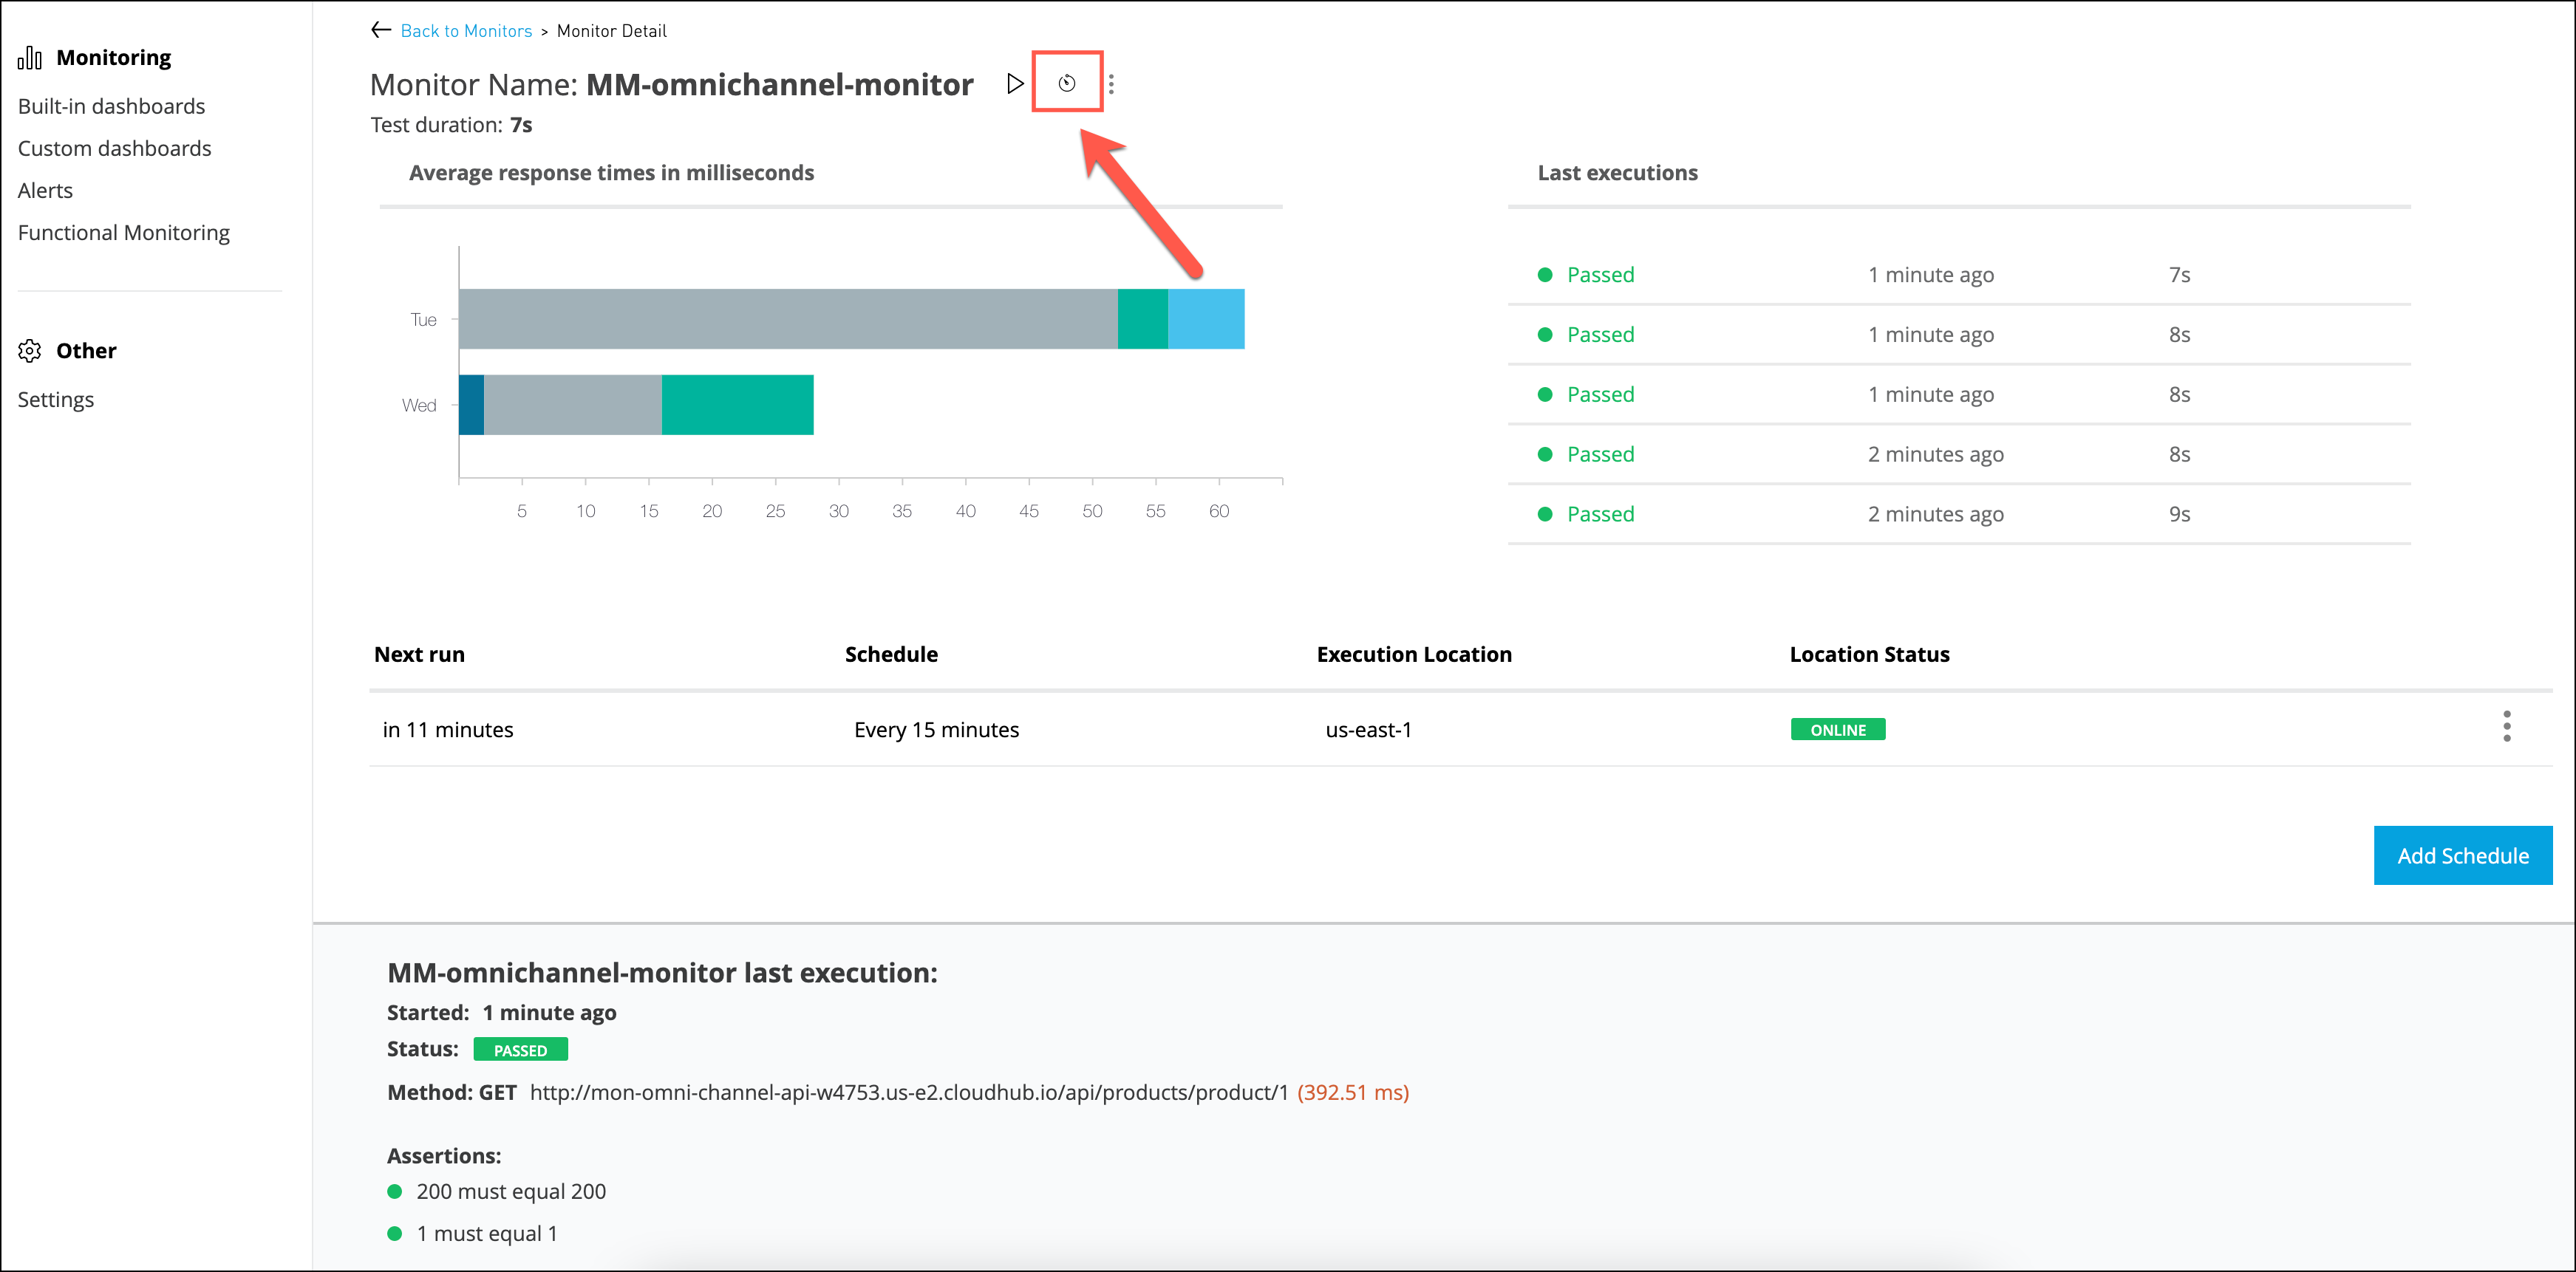
Wait a few moments for the monitor to be created and deployed. The test will execute and start to give feedback on the executions.
Step 3: Review Functional Monitor Output
-
You can view the history of the executions by clicking on the timer symbol
-
The history of the tests will show each execution at a high level

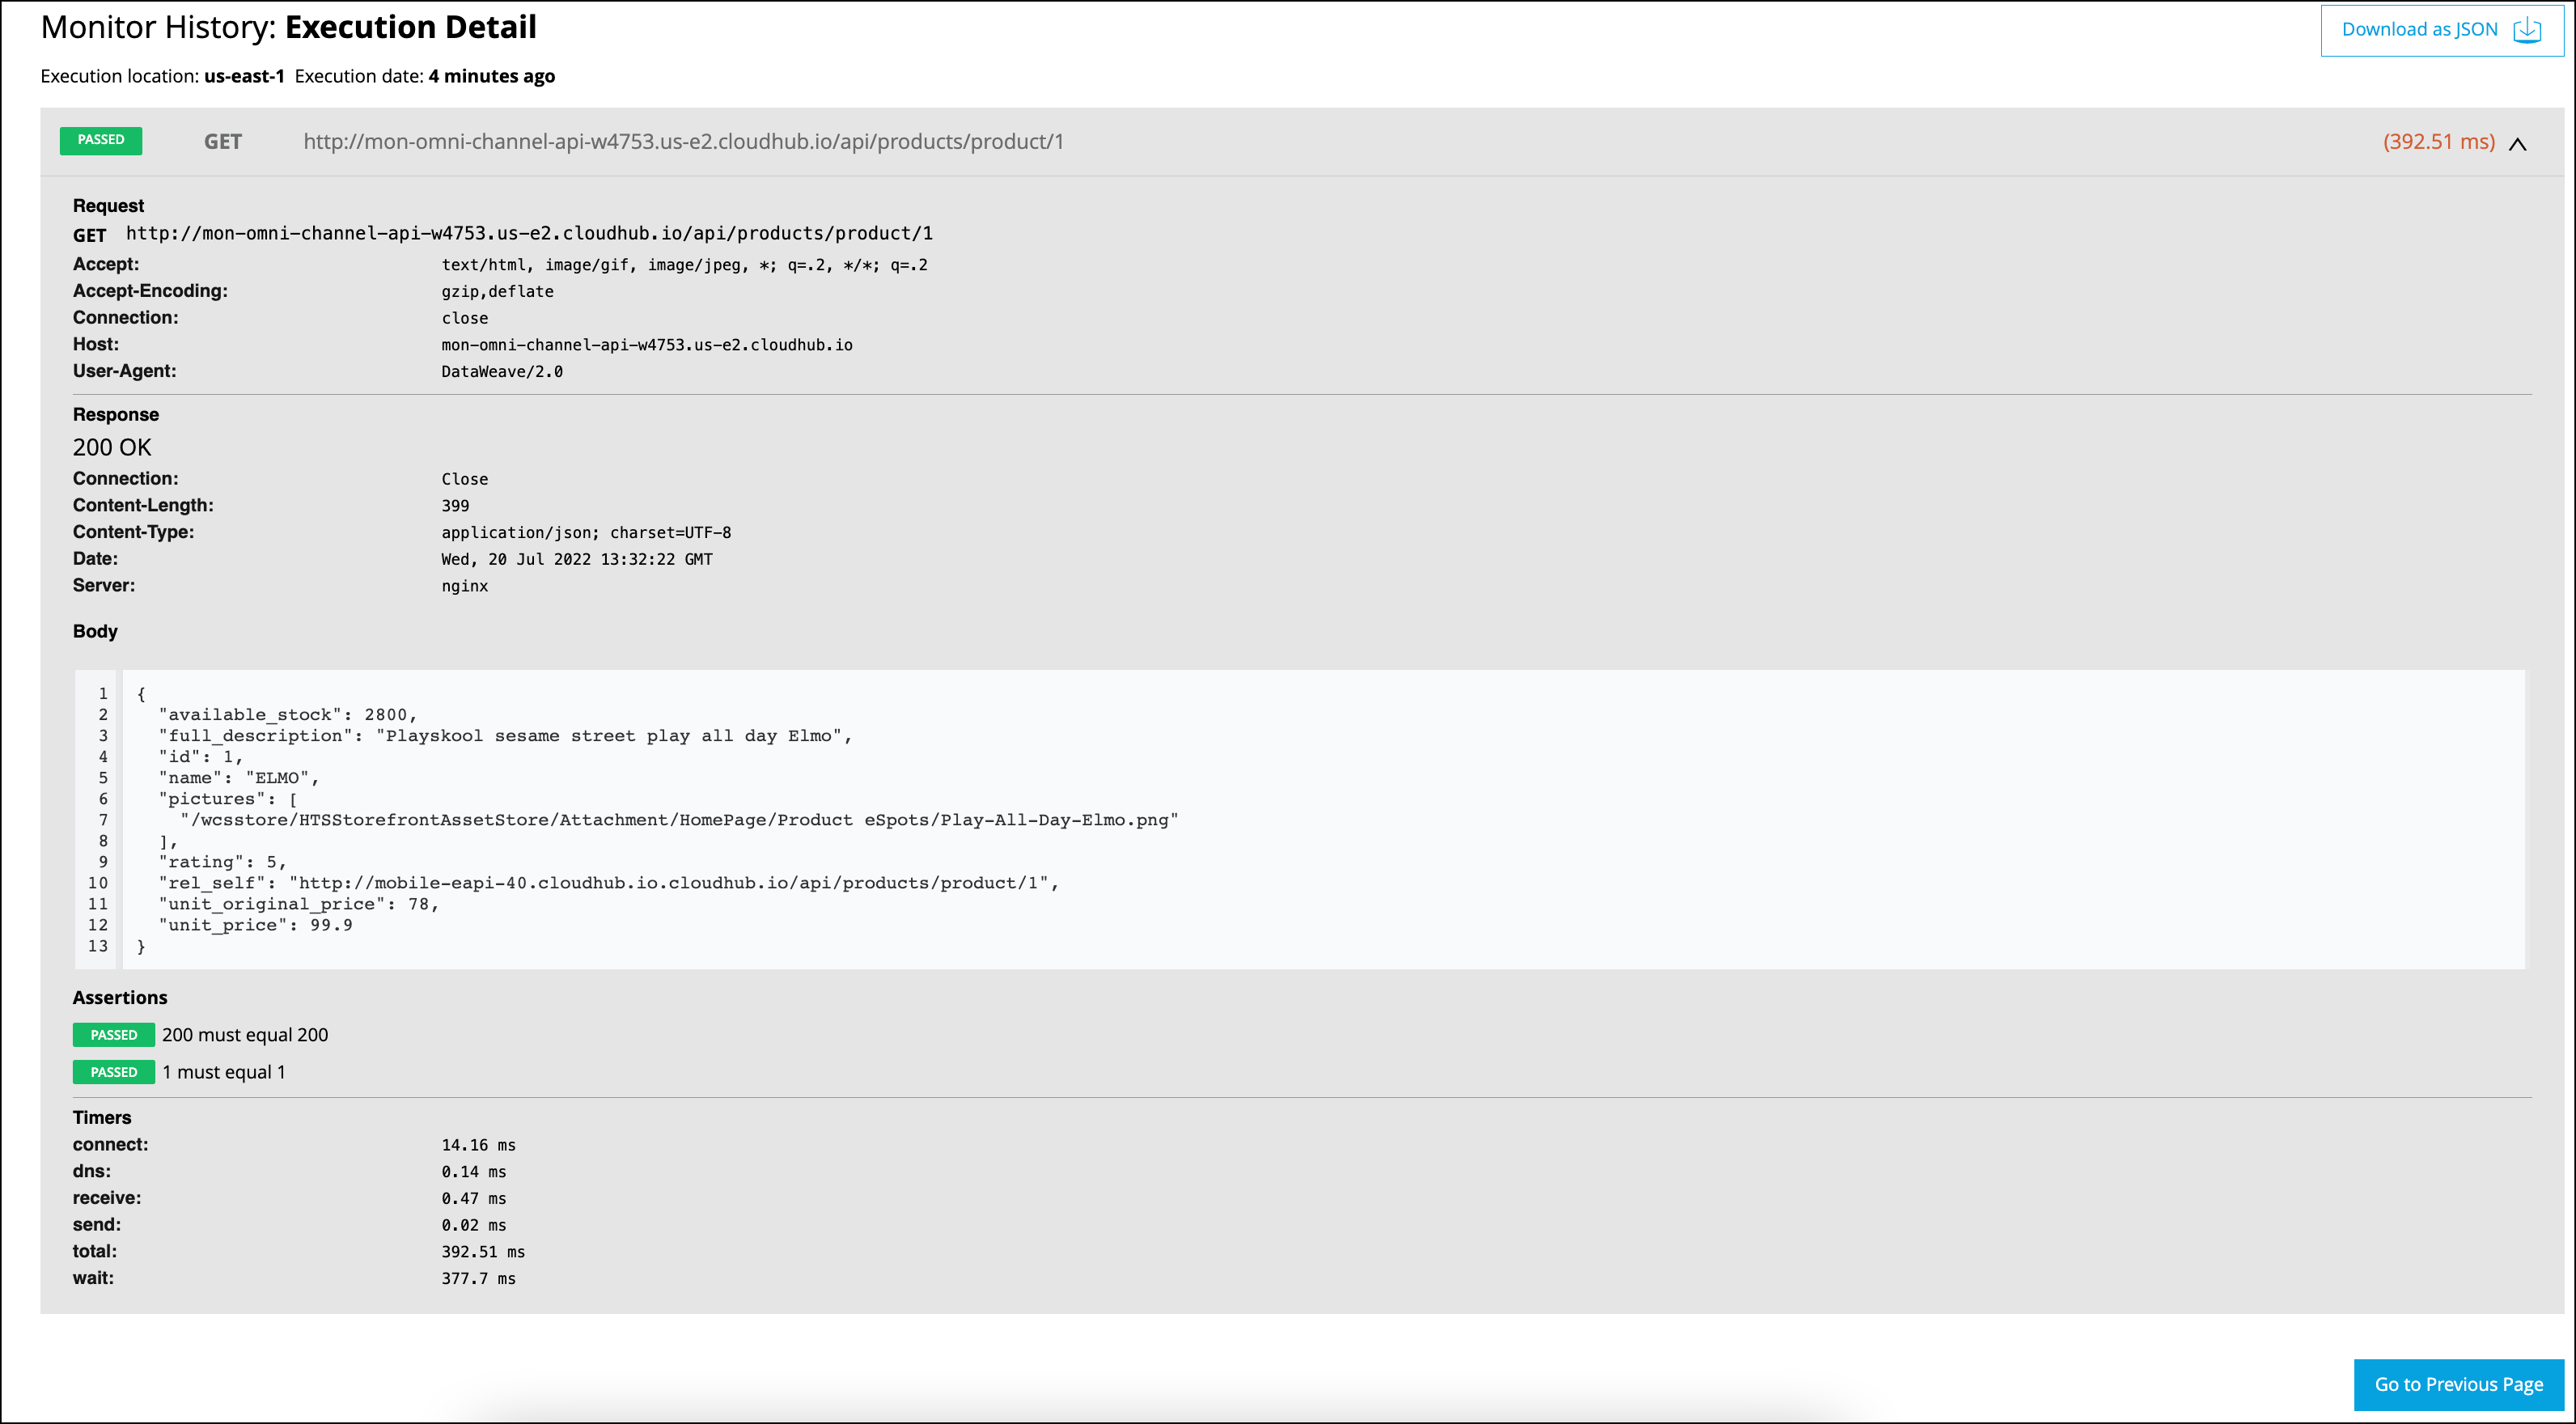
To review the test outputs click on Detail which shows open another view.
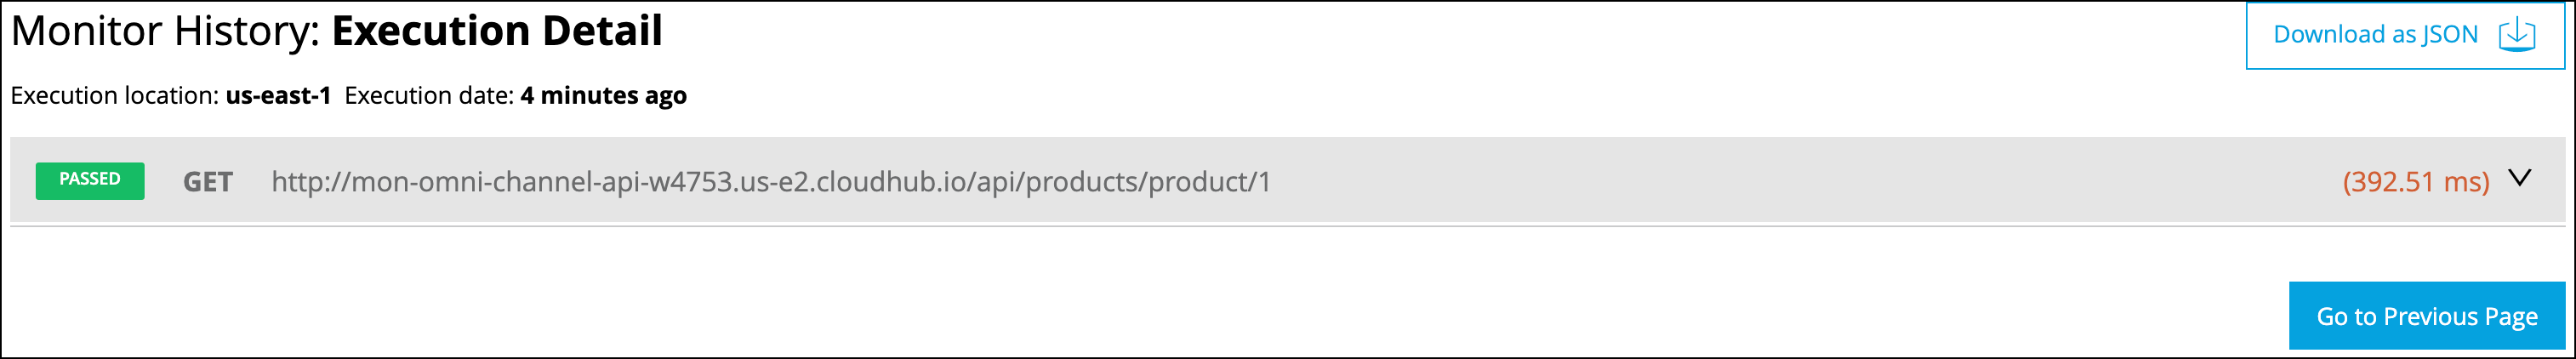
Click the down arrow on the right hand side to review further details on the execution including input HTTP and output HTTP headers and payload. If errors occur on the functional test you will get all the details on the input and output of the call in a downloadable file.
-
Return to the main functional monitoring menu by clicking on the item in the menu on the left
-
Select your functional monitor that you created.
You can get really advanced with functional monitors. Functional monitors can be written in Dataweave which gives you the ability to do much more with your functional monitoring activity.
-
Click the three dots and select
Download monitorto download the test file.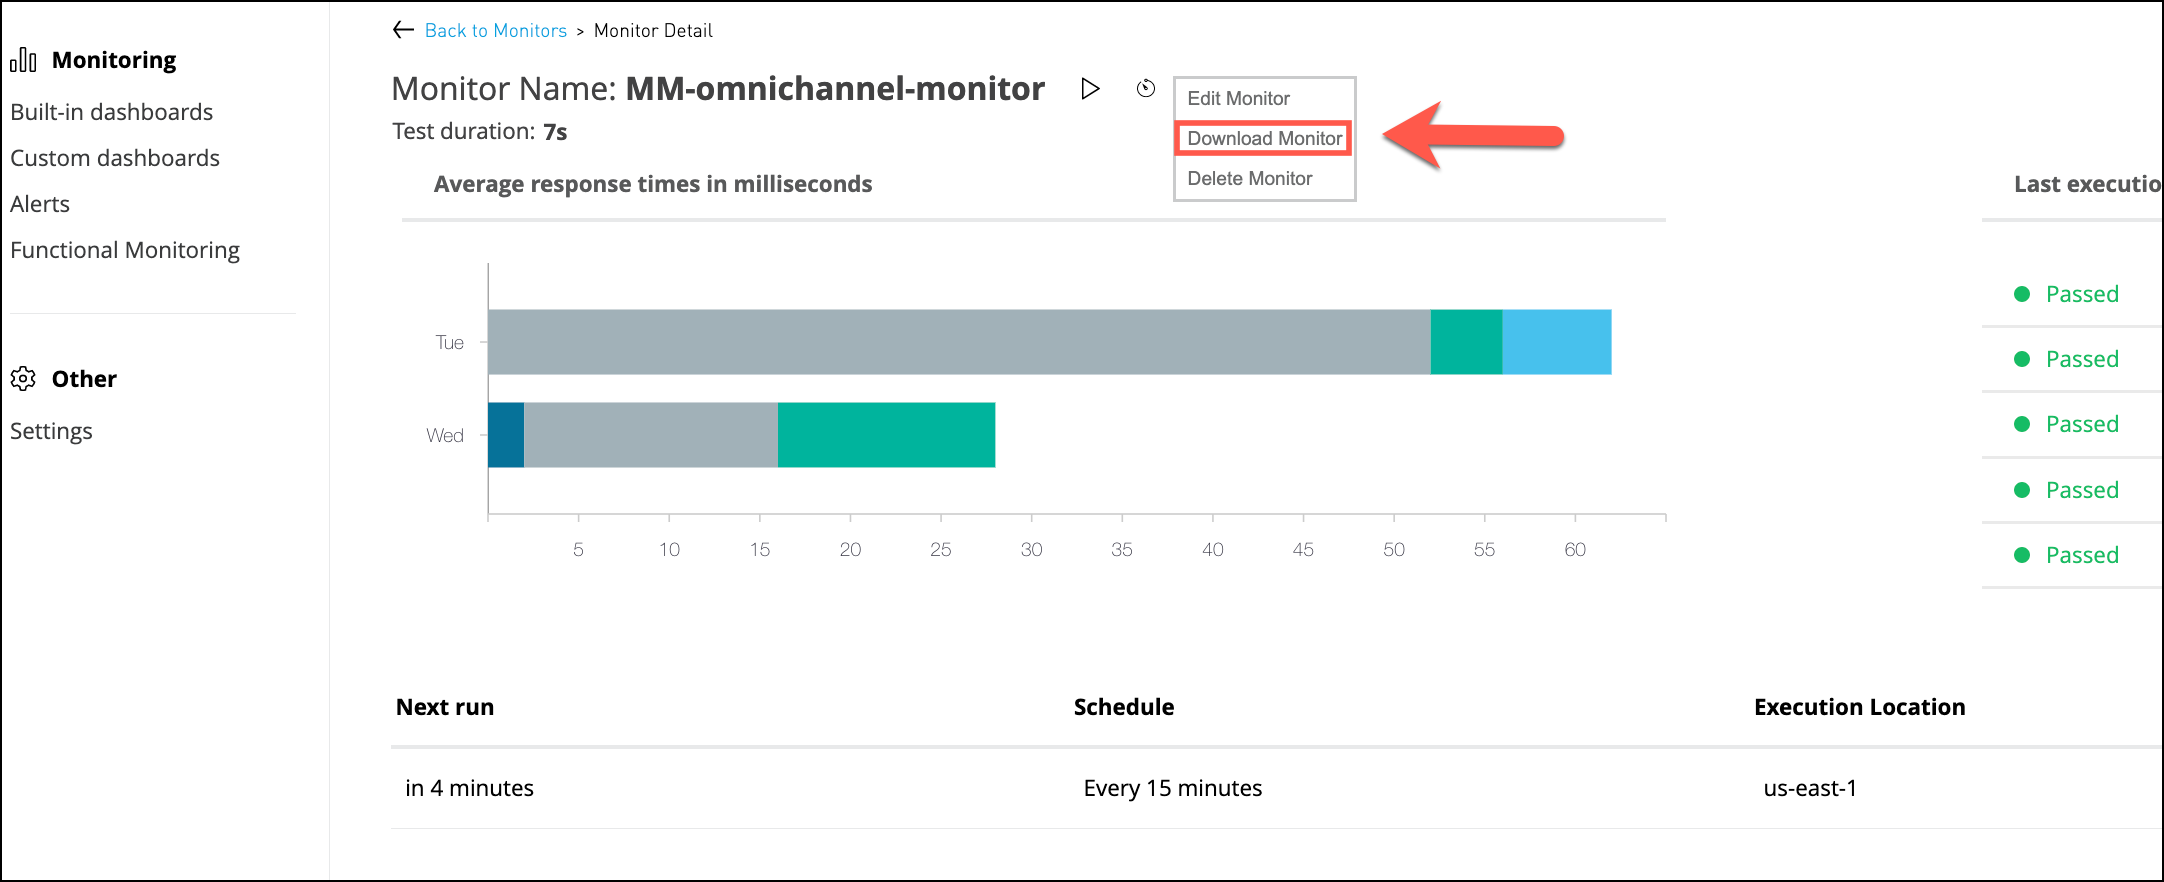
A zip file will be downloaded. Open the archive and then open the
main.dwlfile inside. You will see some Dataweave code that looks similar to the below:
import * from bat::BDD
import * from bat::Assertions
---
suite("mm-omnichannel-monitor1") in [
  GET `http://mm-mon-omni-channel-api.us-e2.cloudhub.io/api/products/product/1` with {
  "headers": {}
} assert [
    $.response.status mustEqual 200,
$.response.body.id mustEqual 1
  ]
]
As an extended exercise in your own time, feel free to edit these scripts and upload them back into the platform to create more advanced functional monitors. You can find all the reference material here.
Summary
In this lab, you completed the following steps:
-
Tested the endpoint using the API Console
-
Created and exercised a functional monitor
-
Reviewed the output of the functional monitor executions and seen how the functional monitors are built up in Dataweave code.
Go Further:
-
See the Functional Monitor doc for more information.
Congratulations! You have completed Lab 3, the final lab of Module
Please proceed to next Module